Showing posts with label MS Project 2021. Show all posts

Friday, June 21, 2024

Planned Vs. Actual Percent Complete – Building A Solid Histogram Report with MS Project


In the earlier article, we learned the Format () function. This function is used to format the Planned % Numbers given when you plan, baseline and track your project. In this article, we will learn how to build a histogram report using the available functionality in MS Project. 

As noted in the previous article, your stakeholders will not see the data, but the report. Hence, it’s important that you learn it well. 

Current Project Case

The current project is very similar to one we have had earlier in the article of Planned and Actual Percent Complete with MS Project, with a slight modification. 

As shown above:

  • Under Phase – 1, 
    • Work Packages A1, B1 and C1 are 100% complete – both planned and actual. 
    • Work Package D1 has been delayed and it’s actually 33% complete, though per plan, it should have been completed.  
    • Phase – 1 end milestone is 50% complete.
  • Under Phase – 2, 
    • Work Packages A2 and B2 are 75% and 50% complete, respectively. Ideally, per plan, they should have been completed.
    • Work Package C1 started late when compared with the baseline (baseline date is shown in the left column) and it’s actually 14% complete, though per plan, it should be 20% completed.  

It’s important to note that the status date is set as September 15, 2025 (9/15/25). It’s highlighted above. 

At this stage, I’d strongly recommend that you read the article of Planned Vs. Actual Percent Complete to get the best value out of this article. 

Create A Fresh Histogram

We will start to create a histogram by going to the Report tab > New Report > Chart, as shown below. 


It’ll pop-up a message to give a name to the report. Provide the name as “Planned Vs Actual - Histogram Report”. A dummy report will be auto-created. You can change the name to “Planned Vs. Actual Percent Complete - Histogram Report” to have more clarity. 


As shown, we have three fields in the above dummy report – Actual Work, Remaining Work and Work. We will remove these fields and have out fields (Number 3 and % Complete) added to it. 

Remove the Default Fields in the Histogram

To remove the fields, select the Chart Area, right click and choose “Show Field List” command. Next from the Field List pane, select the fields and remove them by using “Remove Field” command. You can also deselect the fields from fields available under the “Work” section. 

Add Our Fields into the Histogram

Now that we have removed the fields, we have to add our own custom fields. We will add two fields:

  • Number3 custom field: It’ll be available under Number > Custom.
  • % Complete field: It’s available under Number. 

Both of the above fields are Task related fields. With it, the histogram will be created by taking Number3 and % Complete field.  

And don’t forget to change the Outline Level to Level 3 from Level 1. Because our work packages are at Level 3!

Next, change the labels of these fields to be displayed on the report. Do the following changes:

  • Number3 will be changed to Planned % Complete.
  • % Complete will be changed to Actual % Complete.

This can be done by selecting the respective field, right clicking and choosing “Field Settings”. In the popped-up message, provide the labeling. This is shown below. 


Add and Format the Data Labels

Next, we add the data labels to the columns of the histogram. There are two columns for the two fields of “Planned % Complete” and “Actual % Complete”. These are represented in blue and orange color, respectively. For these we have the data labels, i.e., the % value. 

To add the data labels for the columns in the histogram, select any column, right click and choose “Add Data Labels” command. This should be done for both types of columns. Once you are done, the report will come as shown below. 

As you can see above, there are data labels added for both Planned % Complete and Actual % Complete. But for the former, the % notation next to the number is missing. For this purpose, we will provide the formatting. To do so, select the Planned % Complete Data Labels, right click and choose “Format Data Labels” command.

In the shown Format Data Labels pane (below), select the Label options and then select the Custom category for the Number. This is shown below. 

It’s important to note that the category of label here is custom and type given is “#,##0%”. This way the proper formatting will happen for the labels with respect to the Planned % Complete field, which is shown below.


As shown above, the formatting for Planned % Complete field is clearly shown with % in the notations for the blue colored columns in the histogram. 

In addition, we have to change the data series overlap and gap width so that there is a clearer visualization. The data series are with respect to the columns. To do so, select the Planned % Complete Data Labels, right click and choose the “Format Data Series” command. Then provide the needed value, which is shown below.

Isn’t much clearer now than before?

Change the Color Coding 

Our next and final step is to change the colors for the columns in the histogram. For the Planned % Complete column of the histogram, I’ve taken green color, whereas for the Actual % Complete I’ve taken the purple color. This can be done by going to the Task tab > Font group > Theme colors command.  

In addition, we will also make the labels bold and respective color coded. I’ll also change the rotation of the X-axis to 45%, which can be done by selecting the X-axis (the work package notations), right click and choosing the Format Axis option. 

As shown above, the custom angle given is -45 degree. 

Final Touches

Our final histogram comes as shown below. 


This can be then transported to a PDF file, an image file or a power point presentation. For example, one can use the export to PDF function of MS Project using the backstage view. 


When exported to the PDF, we will have the following view. 


Last Words

That’s it! It might look like a number of steps, but if you go through sincerely and practice a few times, you can easily create this report in a matter of minutes. 

MS Project is a complex tool, but comes with a lot of powerful functionalities. The reporting functionalities given are quite good and you can use them to generate the report for Planned Vs. Actual % Complete. 

I receive a number of questions on the creation of this histogram. I hope this article helps you to prepare the needed histogram anytime in your project planning and tracking. 


References:

[1] Online Video Course: MS Project Live Lessons, Guaranteed Learning or Your Money Back 

[2] Article: Understanding Planned Vs. Actual Percent Complete with MS Project

[3] Article: Planned Vs. Actual Percent Complete – Understanding the Format () Function in MS Project


Saturday, June 08, 2024

Planned Vs. Actual Percent Complete–Understanding the Format () Function in MS Project


One of the most read articles in this website is Planned and Actual Percent Complete with MS Project. I periodically receive questions on it as MS Project practitioners need this functionality. By default, the ‘% complete’ (Actual % Complete) field is available in MS Project software, but not the Planned % Complete. 

The Problem

Now, while data is needed, your stakeholders would like to see the reports – most likely in a histogram. I realized it’s easier said than done for many as they struggle to format the field in certain special situations and hence their report doesn’t come properly. For example, when you add a special task into the already baselined plan, and try to determine the Planned and Actual % complete, you will get the following numbers.


As shown:

  • I’ve added a new task: Special Task of 2 days duration.
  • When tracked, not so readable numbers of 68.8888888888889% is coming for the Top Summary Task and 36.3636363636364% is coming for the Phase – 2 Summary Task. 

The above numbers are not properly readable and hence, won’t be visualizable with our histogram report. You can see the above numbers in this video at 4m:37s.

Current Formula Used

The formatting given for Number 3 with cStr () function, doesn’t help much as this what the cStr () function does according to MS Project custom fields in Project Desktop

CStr

Coerces an expression to data type String.

Syntax

CStr( expression )

expression  Any valid string or numeric expression.

In our case, I’ve concatenated the “%” into the ‘Number 3’ custom field and have this expression. It’s noted as: 

Text1: cStr ([Number3] & “%”)

The Format () Function

The Format () function available for MS Project custom fields is quite useful in this scenario. In this article, we will understand more of it. In an upcoming article, I’ll show how to build the Planned Vs. Actual % Complete in a histogram.

Again, the format function is noted in this link of project functions for custom fields for MS Project. While it’s noted for MS Project 2019, these fields and functions are applicable for later versions of MS Project.

For the Format () function, the documentation notes the following.

Syntax

Format( expression[, format[, firstdayofweek[, firstweekofyear]]] )

expression  Required; any valid expression.

format  Optional; a valid named or user-defined format expression.

firstdayofweek  Optional; a Constant that specifies the first day of the week.

firstweekofyear  Optional; a Constant that specifies the first week of the year.

It’s clearly saying that the Format () function must have a valid expression. It's followed by a ‘format”, which is optional and it can be user-defined format. The final two – firstdayofweek and firstweekofyear – are optional. 

Examples of Format () Function

Let’s take some examples to understand as there is no better way to learn! As shown below, I’ve two custom fields:

  • Number1 – A number custom field. There is no formula given for this field. 
  • Formatted Number1 – A text custom field to have the formatted expression for Number1. The formula given for this custom field is Format([Number1],"#0.000"). It tells to format the Number1 with user defined format of ‘#0.000’.

Do note that I’m directly using the Gantt Chart view of MS Project software. 

In the Number1 custom field, I’ll enter a variety of numbers (positive, negative, with decimals etc.) and the formatted expression will be auto-populated in the Formatted Number1 custom field.

Next, as I enter the numbers, the formatted expression of these numbers is shown in the next column. This is depicted below.


Let’s understand the above formatting:

For 23, it returns 23.000. In other words, Format (23, “#0.000”) returns 23.000.

  • Format (45.55, “#0.000”) will return 45.550.
  • Format (3.35, “#0.000”) will return 3.350.
  • Format (-4, “#0.000”) will return -4.000.
  • Format (-5.76, “#0.000”) will return -5.760.
  • Format (0, “#0.000”) will return 0.000.

You’d have understood why that is the case. The Format () function is taking the number and formatting with “#0.000” expression. 

  • The ‘#’ in the expression, before the decimal point, denotes any number.
  • The ‘0’ in the expression, before the decimal point, is specifically to include the zero. If this is not given, then Format (0, “#.000”) with only a “#” will return ‘.000’. Note that a zero is missing before the decimal. We don’t want that! Do we?
  • The three zeroes, after the decimal, results in the expressions including 3 points after the decimal. If you have four zeros, then it will have 4 points after the decimal.

Other Styles of Formatting

In our previous example, we used Format([Number1], “#0.000”) with the user-defined format expression of ‘#0.000’.  Others can be:

  • String = Format(177.8, "###0.00")  will return “177.80 ".
  • String = Format(4499.7, "##,##0.00") will return "4,499.70".
  • String = Format(9, "0.00%") will return "900.00%".

Interpreting the above formatted expressions:

  • In the first case, we have three hashes (#) followed with a zero (0), before the decimal and two zeros after the decimal. We received the corresponding formatted number.
  • In the second case, we have a comma before the decimal and hence, a comma is included in the formatted output string. 
  • The last case is interesting to note! We don’t have any hash before the decimal, and we have a “%” included and hence, the resulting formatted expression has been multiplied by 100!

Solution to Our Problem

Remember the first problem we started with the for Planned Vs. Actual Percent Complete? 

Now, I believe, you can address the problem. We have to simply change the formatting of the Number3 custom field. The formula used will be the following:

Planned % Complete = Format([Number3],"#0.00") & cStr("%") 

I’ve additionally used the cStr (“%”) to display the % notation next to the number. In the custom field it will be used as shown below.

Next, when you apply the above formula, the value will come properly as shown below.

As shown above:

  • Now, for the top summary task, instead of 68.8888888888889%, we have 68.89% being shown.
  • For the Phase – 2 summary task, instead of 36.3636363636364%, we are having 36.36%

Aren’t these numbers more readable?

Conclusion

There are a number of custom fields and functions available in MS Project software. I'd definitely suggest you keep this link handy, if you want to know more on custom fields and working on them. You can also read the following two foundational articles:

The Format () function is quite helpful if you are using MS Project custom fields. As we learned in this article, this function can format any type of number in the way you want.

In addition, with this Format () function we will have a better report, which we are going to see in the next article.

References:

[1] Online Video Course: MS Project Live Lessons, Guaranteed Learning or Your Money Back

[2] Article: Understanding Planned Vs. Actual Percent Complete with MS Project


Monday, March 04, 2024

WBS Level – 0 (L0) Vs. Level – 1 (L1) with Oracle Primavera P6 and Microsoft Project


Many times, while interacting with the project management or agile practitioners, questions come on the levels of the work breakdown structure (WBS). In particular, the biggest confusion is about the differences between Level 0 (L0) and Level 1 (L1). 

Most project management literature and tools are focused on L1 of the WBS and rarely mention L0! This results in questions such as:

  • Is L0 possible in a WBS?
  • What does it represent?
  • How is it managed with a software tool?

In this article, I’m going to explore the answers to the above questions with hands-on practical software tools. First, to understand, let’s briefly discuss various levels of WBS.

Various Levels in WBS

Following are the levels of WBS:

WBS Level – 1: This is the highest level in a WBS and it represents the entire scope of work to deliver the product or service.

Considering an example of TESTPROJECT (name of the project), it can be assigned a numerical number 1 or a WBS code TESTPROJ. We will see them with examples shortly.

WBS Level – 2: This is the first level of decomposition. These are the major deliverables or areas of work. Remember, a WBS is a deliverable-oriented hierarchical decomposition of work. It means the WBS is broken-down/decomposed the way you want to deliver your work. 

Considering our previous example, the numbering at L2 will be:

  • 1.1, 1.2, 1.3, 1.4, … 1.n
  • Using TESTPROJ code, it’ll be TESTPROJ.1, TESTPROJ.2, TESTPROJ.3, TESTPROJ.4, … TESTPROJ.n

WBS Level – 3: It’s the next level of decomposition or decomposition of L2. Here one can have the major deliverables/areas of work broken down further for better estimation and understanding.  

The numbering schemes here can be:

  • 1.1.1, 1.2.1, 1.3.1, 1.4.1, … 1.n.1
    • At the level of 1.1.1, you can have 1.1.2, 1.1.3, 1.1.4 …
  • Using TESTPROJ code, it’ll be TESTPROJ.1.1, TESTPROJ.2.1, TESTPROJ.3.1, TESTPROJ.4.1, … TESTPROJ.n.1
    • At the level of TESTPROJ.1.1, you can have TESTPROJ.1.2, TESTPROJ.1.3, TESTPROJ.1.4 …

What is Level – 0 (L0)?

This is where the confusion comes-up! Why does one need Lo?

To simplify, here are certain key points with respect to L0:

  • If present, it’s the highest level of the WBS tree or tabular structure.
  • Below L0, in the WBS, you will have L1.
  • L0 is NOT used in the numbering schemes, rather L1 is taken-up for it.
  • L0 is useful, when you are managing multiple projects together in a single file. For example, one can have a large project with multiple WBS (each starting with L1). 
  • Looking at the previous point, all smaller projects, under a large project, can have their own numbering schemes. 

Now, let’s see the practical usages of it.  

L0 and L1 - Oracle Primavera P6

Primavera allows up-to 20 WBS levels by default. You can check the levels under the Admin menu > Admin Preferences > Data Limits tab. I’ve changed it to four for this article.

Next, I added four levels in the WBS tab of Primavera P6’s main screen. 

As shown above:

  • TESTPROJ = Level – 1
  • TESTPROJ.1 = Level – 2
  • TESTPROJ.1.1 = Level – 3
  • TESTPROJ.1.1.1 = Level – 4

So, the highest level is Level 1 in Primavera P6. 

Next, I’ll modify this WBS to make it more formal and have a couple of work packages. 

As you can see, now we have two work packages: Work Package 1 and Work Package 2 at L2. The WBS codes are WP1 and WP2, respectively. The Project ID is another column as TESTPROJ, which is L1. 

Did you notice how the WBS code is noted? It’s ProjectCode.WBSCode, e.g., TESTPROJ.WP1.

Next, for each work package, we have four activities and they are all linked with finish-to-start (FS) dependencies. This is shown in the Activities tab. I’ve added the WBS, WBS Name columns under the Activities tab to have better clarity.

As one can check, there is a Work Package 1 (WBS Name) that has a WBS (Code) as TESTPROJ.WP1. It has four tasks: Task 1-1, Task 1-2, Task 1-3, and Task 1-4. All the tasks in the respective packages are linked.

Considering the WBS levels, we can have following interpretations:

  • Highest level is TESTPROJ (L1).
  • Next level is TESTPROJ.WP1 (L2) and TESTPROJ.WP2 (at Level 2).
  • These are also reflected in the graphical side of the Gantt Chart.

Hence, in Primavera P6, there is no Level 0 (L0), but only Level 1 (L1). This L1 can be further decomposed to any level you want.

L0 and L1 - Microsoft Project 

To demonstrate Level 0 (L0), I’m going to use the MS Project software. The below commands/usage will be valid for all versions of MS Project from MS Project 2003. 

Just like the previous situation, here too, we have a Test Project (Project Name) with two work packages – Work Package 1 and Work Package 2. Each work package has four activities. The plan is shown below. 

Unlike Primavera P6, there is no separate WBS tab or command available in MS Project. To see the WBS code, you have to add the “WBS” field available in the software. This can be added by right clicking and using the command “Insert Column”. 

When added, we will get the following view.

As shown above, in the Test Project we have two work packages (WP 1 and WP 2).

  • Test Project = L1
  • Work Package 1 and Work Package 2 = L2
  • Various tasks under the work packages = L3

So, where is L0?

For that, you have to enable the Project Summary Task command under Format tab > Show/Hide group. 

After you enable it, Level 0 (L0) will appear in the MS Project plan as shown below.

As shown:

  • A new line entry is auto-added and it’s named Project 1This is Level 0 or Lo.
  • This is one level up the L1 and also shown in the graphical side of the Gantt Chart.
  • The lower levels such as L2 (work packages) and L3 (tasks) are also shown.

Conclusion

In conclusion, you can say Primavera P6 does not have L0, but MS Project does! Earlier in the article, I’ve noted certain key points about L0 for a WBS.

Another usage of L0 is when in the same project, you have different kinds of work and you want to keep them all at L1. Say, a project has different work and you want to have different WBS codes being applied to those work. With L0 availability in MS Project, you can perform those operations.

However, if you are using Primavera P6, there is no L0 and it’s not needed. This is because in Primavera, the WBS code is built separately in another tab and then activities are added to the WBS levels. 

I hope this article gives clarity on how and when the L0 and L1 are used in a work breakdown structure with real-world and widely used software tools.


References:

[1] Online Course: MS Project – Live Lessons, by Satya Narayan Dash.

[2] Article - Work Breakdown Structure in Traditional and Agile Life Cycles, by Satya Narayan Dash


Saturday, September 30, 2023

Mastering MS Project Agile: Task Board without Sprint Associated Tasks – How To Do It?


I frequently interact with Agile and Hybrid-Agile practitioners who use my Mastering MS Project Agile course and/or Certified Hybrid-Agile Master Professional (CHAMP) certification course. For interactions, I mostly use direct video calls because that way one can quickly learn the problems faced by them and whenever possible, I can provide a quick solution then and there. Both these courses are of high quality, go from beginner mode to an expert level and put you in a path of solid skills on Agile and Hybrid-Agile management, respectively.

One of the recent questions I faced is the below one:

“There are a number of Sprints in my Agile plan. But when I open the task board, all these tasks are shown in the Task Board view. I don’t want to see them there! What should I do?”

The above question is by a keen learner, Ravi O'Reilly. You can read her review and experience.

This article will demonstrate how to achieve this result and get the solution to the problem.

The Fundamentals

First, a few lines on the basics or the fundamentals. MS Project Agile has many board and sheet views for working with Scrum (Sprint), Kanban and Waterfall. Specifically, irrespective of the methodology or framework used, Task Board is available under View tab > Task Views > Task Board view. 

By default, this board view will show all the tasks that entered in another view, say the Gantt Chart view. In the below case, I’ve added five tasks to the project plan and they are represented below. 


As you can see, we have five tasks – Task 1 to Task 5, and they are not associated with any Sprints. 

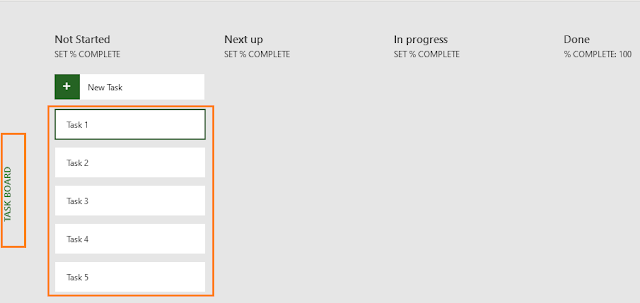
Now, when I go to the Task Board view, we get all the tasks in that view.  

But the requirement is not to show any “No Sprint” task or “Sprint 1, Sprint 2, … Sprint N-1” task in the Task Boards. Simply put:

  • Tasks which have “No Sprint” should not be shown in the Task Board view. 
  • In addition, any task is associated with Sprints, they should also not be shown at all in the Task Board view!

So, what to do?

Let’s see the solution!

Create A Custom Filter

The Task Board does NOT have a filter applied. However, one can create a custom filter and apply it to the task board.

There are two scenarios.

First Scenario: You don’t want to show the “No Sprint” items. This is actually the question that we started with. Hence, I’ll try to address that first. 

In our custom filter, we will have the following conditions:

  • Show on Board field equals Yes
  • Summary equals No
  • % Work Complete does not equal 100%
  • Active equals Yes
  • Sprint does not contain No Sprint

The last field condition informs the “Sprint” field (available in MS Project Agile) will not contain “No Sprint”. This is depicted in the below figure.


As shown above:

  • The filter name is Custom Task Board Filter. To create a filter, you have to go to the View tab > Data group > No Filter drop down and choose 'New...' filter command. 
  • This filter has all the needed conditions, including the condition which will not show the Sprint containing the “No Sprint”.
    • Again, do note the last condition. This will filter out all the tasks, which are not associated with any Sprints.

Apply Custom Filter To the Task Board View

Now, you have to apply this filter to the Task Board view in MS Project Agile and the result is shown below.

If you want you can create a Custom Task Board view and apply the recently created Custom Task Board Filter into the custom view. This is also an accepted practice and indeed, a good one. However, to keep it simple, I'll use the existing Task Board view.


As you can see, all the tasks which are having “No Sprint” in the Sprint field are no longer visible.

Another Scenario

There can be another scenario as well, which can come-up.

Second Scenario: You don’t want to show not only the “No Sprint” items, but also tasks associated with any Sprint. In other words, you don’t want to show any Sprint related items (No Sprint, Sprint 1, Sprint 2, … Sprint N-1) in the view.

This is also asked by my course users. Because they want to see the Scrum/Sprint related items only in the Sprint related board views such as Sprint Planning Board view, Current Sprint Board view etc. However, they want to show the Kanban related items in the Task Board view.

This also can be done and you just have to change the filter conditions, which will exclude any string containing “Sprint” word. 

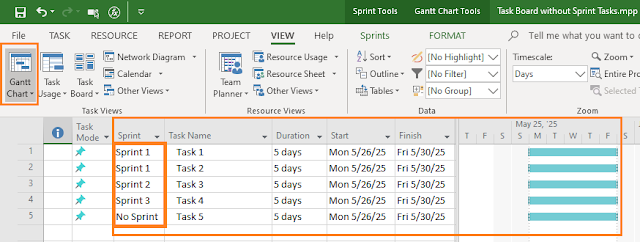
For example, in our list of tasks items, we have the following tasks associated with various Sprints.

As shown above:

  • Task 1 and Task 2 are associated with Sprint 1
  • Task 3 and Task 4 are associated with Sprint 2 and Sprint 3, respectively.
  • Task 5 is not associated with any Sprint.

When you switch to the Task Board view, we get the following.


The Custom Task Board filter has been applied, but we have still 4 tasks visible! 

How is that possible?

This is because the filter condition tells not to display the task associated with "No Sprint". But, all other tasks will be shown. Hence, we have to change our custom filter - more precisely the last condition! The modified filter will be the following. 


Next, when you apply this modified Custom Task Board filter to the Task Board view, you can fully filter out the tasks associated with any Sprint (Sprint 1, 2, 3 … N-1) or No Sprint. 

Is is not simple and very effective? 

You can customize the view anyway you want.

MS Project Agile and Customization

MS Project Agile provides high flexibility with custom boards, custom views, custom filter, custom group and of course, you also have many programming options with various custom fields and functions.

You can effectively use them to apply in your job in a leadership role and/or as a management professional.

The Mastering MS Project Agile course has a dedicated lesson for this purpose. It’s part of the Lesson – 7: Custom Agile with MS Project Agile. 

To see the complete index of this course, including the customizations possible in MS Project Agile software, you can refer to this link


References:

[1] Master Course: Mastering MS Project Agile, by Satya Narayan Dash.

[3] Video Course: Microsoft Project Live Lessons, by Satya Narayan Dash.


Wednesday, June 28, 2023

Management Yogi's Hybrid-Agile (CHAMP) Certification: Baselining and Tracking A Hybrid-Scrum Project with MS Project Agile


A well-know mantra for management practitioners is this: planning is indispensable, plans are useless. In other words, you need to plan because you must convey information, establish agreements with your team, vendors, and other stakeholders, and enable decision-making. However, you must also know that your plan will change frequently. These changes are inevitable when you execute, monitor, track, and make necessary adjustments.

You earn your salt as a PM with these necessary adjustments to your plan. As a matter of fact, I believe monitoring, tracking and controlling will consume most of your time as a PM. The process can be quite complex.

The complexity of managing and tracking a Hybrid project goes up by at least an order of magnitude. Hybrid-Agile projects are a reality nowadays, rather than exceptions. As an Agile practitioner, sound understanding, management, and tracking of Hybrid projects will be key skills in your arsenal. This article will build and enhance your skills in Hybrid-Agile management.

In this article, we will learn how to track a Hybrid-Scrum project, starting with where our project currently stands. We will learn how to do baselining and setting of the status date. We will set up the necessary custom fields to differentiate between predictive and adaptive parts, followed by tracking of both parts. Finally, I’ll share a video demonstration and concluding remarks.

Our Hybrid-Scrum Project Scenario *** UPDATED ***

In an earlier article, Building a Hybrid-Agile plan, I had explained the structure of a project with many phases in predictive mode and some phases in development to be executed with Scrum as a background Agile framework. As a project like this progresses, I’ll demonstrate setting the status date and tracking it.


As shown:

  • We have multiple predictive phases with an emphasis on the Development phase.
  • The Development phase has a Scrum Development part, which will run in parallel with the Predictive Development part.
  • The status date will be set at the middle of Sprint 1, and tracking will happen with respect to this date.
  • Each Sprint lasts for two weeks. You can set any other duration for the Sprints, but it should be planned from the very beginning.

Baselining Hybrid-Scrum Project

Before tracking the predictive part, we need to first baseline the project. We are not going to baseline the Adaptive part of the project, as the time is boxed (timeboxing) for the Sprint’s duration. Note that if the items in the current Sprint can’t be completed, then it’s usually moved into the next Sprint. 

The predictive part can be baselined by going to the Project tab > Schedule group > Set Baseline … command as shown below:


Baselining a Hybrid project is somewhat tricky because such a project will have several items that are predictive, as well as items in adaptive modes.

The below video [duration – 4m: 31s] demonstrates how baselining is performed for a Hybrid-Scrum project. This content is taken from my Certified Hybrid-Agile Master Professional (CHAMP) course. For the best experience, you may want to go full screen in HD mode and use headphones.


Understanding baselining will be important as we proceed with tracking the predictive part of this project.

Status Date Setting and Analysis

After setting the baseline, we must set the status date for the project against which the tracking will happen. This applies for both the predictive and adaptive parts. Without proper setting of the status date, you can’t have the right variance analysis.

The status date can be set by going to the Project tab > Status group and using the Status Date: command.


Note these important considerations from the above view:

  • The Sprint 1 Planning task (0.5 days duration) highlighted above shows the Sprint Start and Sprint Finish dates. Sprint 1 begins on October 10, 2022 and finishes on October 23, 2022. You can learn more about end-to-end Sprint planning here.
  • The status date has been set for the entire project. It’s mid-Sprint 1, as the date is set to October 17, 2022.
  • All Scrum work items are associated with respective Sprints (Sprint 1, Sprint 2, and Sprint 3), whereas the predictive work items are not associated with any Sprint.
  • The Pre-Sprint Work task (2 days duration), above the Sprint 1 Planning task, is part of Agile development work, but not associated with any Sprint.

The Sprint Planning Board view shows all the work items to be done in three Sprints. You can plan as many Sprints as you need based on your release planning with the Manage Sprints command under Project tab.


Show on Board and isAgile Fields

At this stage, you may be wondering how the items will be segregated for tracking when you consider their Sprint associations. This is done by two fields:

  • Show on Board field: This is a built-in field of MS Project. For most of the Scrum work items (across all three Sprints) have this field enabled, whereas for the predictive/waterfall items it is not.
  • isAgile field: This is a custom Boolean field to distinguish Agile work items from non-Agile ones. It’s used because some of the items are not directly associated with any Sprint and, therefore, may not be displayed on the board views. These items can be Agile work items, for example.

These fields can be added to the Gantt Chart view. Corresponding settings have to be done for all the work items for the entire Hybrid-Scrum project. 


As shown above:

  • We have two new fields/columns added for the Gantt Chart view: Show on Board and isAgile.
  • Work items under the Predictive Home Development sub-phase have both Show on Board and isAgile fields disabled.
  • Work items the under Agile Home Security sub-phase have both Show on Board and isAgile fields enabled, e.g., the Feature- Smart Entry (Task ID 19) with all its subtasks.
  • For some of the work items, the Show on Board field disabled, whereas the isAgile field has been enabled, e.g., the task of Pre-Sprint Work (Task ID 17) under Agile Home Security Development sub-phase.

The isAgile field must be carefully set for the work items in the Agile Home Security sub-phase. A demonstration of both these fields is shown in the final video of this article.

Monitoring and Tracking the Predictive (Waterfall) Part *** NEW ***

We are going to track the predictive part of this Hybrid-Scrum project using the Gantt Chart view, though you can very well use other views, such as Tracking Gantt view. To track, it’s a good idea to add the % Complete field in the tabular side of the Gantt chart.


The tracking of the predictive work items can be done with many options available in MS Project software:

  • %, 25%, 50%, and 100% commands given in the Schedule group of the Project tab.
  • Mark on Track command and Update Tasks command, which are again under the Schedule group of the Project tab.
  • Update Project command under the Status group of the Project tab. This command can be for the entire project or a set of selected tasks. 

Remember to only use these commands to track the predictive part of the project, not the Agile/Scrum part. Items for which the isAgile flag is enabled, but the Show on Board field is disabled can also be tracked using these commands. We learn more in the final video.

After you are done with part of your tracking for the predictive work items, your Gantt Chart view will appear as shown below.

Interpreting the above figure, one can say the following for the predictive part:

  • All tasks under the Start-up phase are complete (100%).
  • The two tasks (Task IDs 7 and 8) under the Planning phase are 80% and 75% complete, respectively.
  • One task under the Predictive Home Development sub-phase, i.e., Interior Change (Task ID 11), is 64% complete.
  • The duration of the entire project has changed to 96 days. Earlier it was 92 days. You can compare it with the second figure shown earlier, where I’ve highlighted the 92-days duration.
  • The respective change-highlighting of tasks have been done for the modified ones.

It’s pertinent to note that % completion of these tasks is as on the status date, which is highlighted above as the vertical red line on the right.

Monitoring and Tracking the Agile (Scrum) Part

Next, we must track the Agile-Scrum part of the project. For this, we are going to use the Current Sprint Planning Board view. Before you track, you should have set the % COMPLETE value for the workflow states (columns) on the board. 

As shown:

  • Board columns Next-up, In Progress, and Done are set 10%, 50%, and 100%, respectively.
  • The Sprint Backlog has been set 0%. I’ve renamed this column from Backlog to Sprint Backlog.

Tracking of these items will happen according to the status date, which was set earlier as October 17, 2022. 

For the Scrum part of the project, MS Project software with its Agile features makes it very easy to track with boards. You just need to drag and drop items on the Scrum Board from one workflow state (column) to another.

After you complete your tracking, it will appear as shown below:  


Interpreting the above figure, one can say:

  • The Sprint 1 Planning task is complete.
  • Several Daily Scrums are also complete.
  • Several tasks under the feature items are also complete, e.g., sub-tasks for the Feature – Smart Entry.
  • Several sub-tasks for the Feature – Smart Alarm are under the In Progress column, such as Check points to install alarms, Install security alarms and the sub-task, Test alarm installations, is under the Next up column.

To learn about all the features being developed under Scrum mode with all sub-tasks, you can refer to this article.

For the task items represented as cards on the board, I’ve customized and added a number of fields, such as Start and Finish dates, along with the Summary Task Name.

It’s also worth noting that for tasks which are moved into the Done column of the Current Sprint Board view, blue tick marks are shown on the top right side of the card. This means these tasks are 100% complete.

Pro Tips: Hybrid-Scrum Project Baselining, Monitoring and Tracking

We have proceeded in-depth and step-by-step on how to track a Hybrid-Scrum project. Now it’s a good time for some pro tips. The video below [duration – 4m:25s] breaks down a few simple tips for tracking Hybrid-Scrum projects.


Frequently Asked Questions (FAQs) – Hybrid-Scrum Management *** UPDATED ***

Can the Adaptive/Agile part of the Hybrid-Scrum project be baselined?

As informed in the first video related to baseline, one can definitely baseline the Agile/Scrum part of the Hybrid-Scrum project. It’s highly possible you may have to report Agile earned value management related metrics such as SPI, CPI, SV, and CV. All these metrics will require baselines.

Can one have separate reporting for the Predictive and Adaptive parts of the project?

Yes, absolutely you can. However, you need to have customizations to do separate reporting.

As the Project or Program Manager (or Agile Project/Program Manager or the Group Scrum Master), it’s your job to make these decisions in consultation with your key stakeholders, such as customers, Product Owners, and/or Product Managers. These decisions should be made before the project or program gets kicked-off.

Can one show critical path and critical tasks in this Hybrid-Scrum project?

Yes, you can. The concepts and fundamentals of critical path don’t change with a Hybrid-Agile project. You can show the critical path (s) in the Gantt Chart view of the MS Project Agile.

Can one conduct forward and backward pass and visualize the results in a Hybrid-Scrum project?

Yes, you can definitely do both. All forward and backward pass related parameters will be visible for you if you have planned and tracked the project properly.

Conclusion

In the beginning of this article, I noted that tracking of a Hybrid-Agile project is highly complex and can be quite tricky. You need to be very careful during planning, execution, and tracking of the tasks, and using the association or non-association of tasks with Sprints that have custom fields to help you with grouping, filtering, and reporting.

I hope you now have a better understanding on tracking Hybrid-Agile projects and it brings value to your work.

--

This article was first published by MPUG on November 15, 2022. This an updated version. 


References

[1] NEW Certification Course: Certified Hybrid-Agile Master Professional (CHAMP), by Satya Narayan Dash

[2] NEW Online Course: Mastering MS Project 2019 Agile (Scrum and Kanban), by Satya Narayan Dash