Showing posts with label Scrumban. Show all posts

Sunday, September 24, 2023

Mastering MS Project Agile Course Review–An Absolutely Delightful, High-Quality Course At A Very Low Cost!

By Ravi O’Reilly, CHAMP


Why this Course?

I decided to purchase this course after a lot of extensive research for a specific purpose after being tasked with building and managing a programme plan with Agile methodologies. I could not find any examples, templates, or learning anywhere and I was absolutely delighted when I came across ManagementYogi’s Mastering MS Project Agile course

My task was to create an MS project plan template for my team which shows all aspects of agile and traditional waterfall and then from that provide a rolled-up view of a programme plan. When I contacted Satya, he advised me to start with this course. I am so pleased I made the decision to take this course, it has met over and above my basic requirements.

Unique Selling Point (USP)

This entire course is so unique. It starts from the beginner steps right the way through to where you become comfortable with how MS Project agile tools actually works and gets you into advanced concepts practically and theoretically.

The course covers in detail all the different boards and views available, how to get in and out, how to input the data, how to remove data, where it appears, how to sort the tasks, how to move them, how to create the custom views, all the reporting views, the terminology, there are many, many aspects to it. 

Basically, the course takes from a beginner level to an advanced level and to the level of an expert.

What I Learned and How It Helped?

I’ll highlight the following things that I learned so far from the course:

  • I really now understand what agile projects are and what my team is working on. Nothing is missed out which means you really get to know the MS Project agile tool inside out.
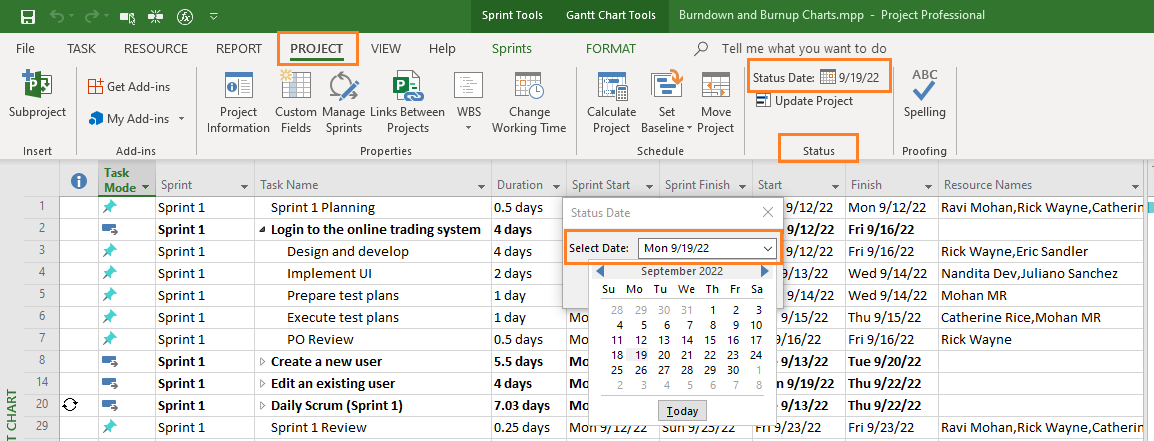
  • I got a good grip on the various board and sheet related views of Scrum and Kanban, which view is used for what and how to get to them, various Agile/Sprint/Kanban fields and associated functionalities. 
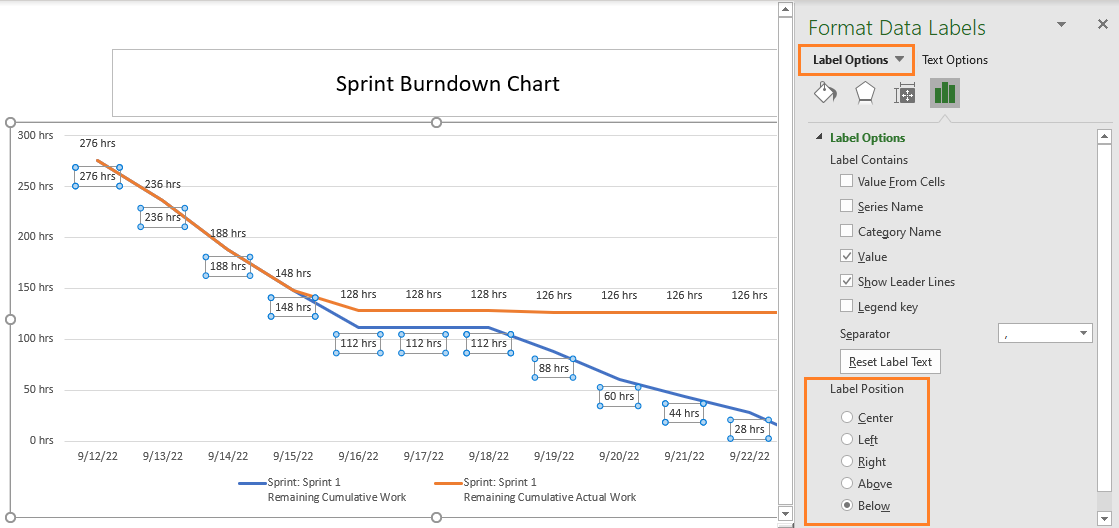
  • I learned how to build burn-down charts, burn-up charts. I learned how to create charts and how to make them presentable using all the extra tools and tips. It is very detailed which means you can very quickly become proficient and an expert in this.
  • It is definitely practically-led, nothing is left out. In my opinion, if someone is learning this for the first time or even if they know how to use the MS project software with Agile functionalities, it is still worth doing.
  • It has really empowered me. I can confidently speak about how the Agile plan(s) should be put together. I know when project managers themselves are not understanding how to plan their own deliverables with MS Project (Agile). I can definitely help guide them and apply best practice and industry standards after doing this course.
  • Providing all the exercise files were so helpful for me. You can easily follow along with the video and see how it should look in the actual file. And then can create your own files. This course’s solution files will give you the foundations to build your learning.
  • Agile in a hands-on manner with MS Project is a niche skill. I am in a Planning Manager role and MS Project Agile is a highly sought-after skill. This course definitely fast-tracked my skill set. It will make you stand out in whatever project management field you are in.
  • The explanations are simple, clear and understandable and one can grasp all the technical terms as well. The videos are well presented, everything is organised, neatly structured. You get all the materials, a course structure guide, which helps to know where you are and how many lessons and videos you have left. I really absorb Satya’s teaching style and format.
  • I received helpful answers to my queries when I had questions and I continue to get support for my learning. ManagementYogi’s work is such a useful resource for me and he has got me out of what was thought as an impossible task and I have definitely impressed upon my team.
  • I’m revisiting all I learned. Now I am finishing the last part of the course, i.e., Advanced Scrum and Advanced Kanban.
  • It is such a great investment in many aspects, in terms of your own time, your own learning, your own career path, nothing is rushed, you can pace yourself, and you can go over things. If you don’t get it in the first few videos, you soon start to pick it up as the steps and learning are repeated.

I really appreciate the full value and I am very much grateful to management yogi for sharing his expertise, knowledge and experience and for going into so much depth and making the user comfortably know what they are doing.

Recommendations

I am surprised at the very low cost for the high quality and amount of training one receives. You basically get more out of it than you would expect. In my opinion it seems too good to be true, but it is true. It covers the entire length and breadth of MS Project Agile. 

Whilst you are learning you get all these extra tips, when something can’t be done in MS Project Agile, the bonus is that there is a way and there is always a work around and this course gives you that as well. 

You are likely to come across in real life work and at least then you have a way to fix things and you are not left stranded. So, everything is covered in this course and again I am grateful to Satya for covering this in the course. Thank you so much ManagementYogi.

Wherever you are in your professional journey, I thoroughly recommend this course and would encourage you to just go for it. You have nothing to lose and everything to gain. 

Brief Profile:

Ravi O’Reilly: Planning Manager Role, Working in UK Government and Transport related programmes and projects and application of industry best practice planning standards.


You May Also Like:

[1] Master Course: Mastering MS Project Agile, by Satya Narayan Dash.

[3] Video Course: Microsoft Project Live Lessons, by Satya Narayan Dash.


Sunday, November 27, 2022

Step-by-Step Guide: Install, Set-up and Run MS Project 2019/2021 with Agile Features (Online Desktop Client)

Want to master MS Project Agile? Learn in and out of it?

Course available at a very low cost: ðŸ‘‰ MASTERING MS PROJECT AGILE

The course comes with a full money-back guarantee!

The free article follows.

--

Summary: MS Project has full in-built Agile features available for the Online Desktop Client version. When customers purchase my courses of Mastering MS Project Agile and/or Certified Hybrid-Agile Master Professional (CHAMP) courses, the first question that comes up is: how to see these features in MS Project? 

In fact, many struggle to install and hence can't use the Agile and Hybrid-Agile features. In this post, you will learn how to install, set-up and run MS Project in a step-by-step manner.

Note: Though I've mentioned MS Project 2019/2021 software with Agile Features, it’ll work with the latest version of MS Project. I personally use the software. The software is released continuously and when you download, you will get the latest version. You have to just follow the below steps.


Frequently Asked Questions (FAQs)

First and foremost, I receive the below questions frequently from the customers, users and aspiring users who want to buy the courses. Hence, I’ll address them first.

Question – 1: I already have a licensed version of MS Project installed. It does NOT have Agile features. What should I do?

Answer – 1: Simply uninstall the existing software. Go ahead and install MS Project 2019 Online Desktop client. You can try for one month and more. 

If you want to revert back to your earlier version, then simply uninstall the current Online Desktop Client and install your earlier version. It’ll work as you have the licensed version.

Question – 2: I do NOT have any version of MS Project software installed. But I want to use the Agile features. What should I do?

Answer – 2: Follow the steps mentioned in this post. After the MS Project Online Desktop Client is installed, you can run and check the Agile features.

Question – 3: How do I know that the MS Project Online Desktop Client has installed properly with its Agile features?

Answer – 3: Follow the steps mentioned in this post. I’ve shown a clear demonstration on how to install, run and check the Agile features. In the final step, I've informed on the verification with respect to Online Desktop Client.

Question – 4: Will I get a PDF version for installation steps when I go for the courses of Mastering MS Project Agile and/or Certified Hybrid-Agile Master Professional (CHAMP)?

Answer – 4: Yes, absolutely. You will have detailed step-by-step instructions with complete explanation, when you subscribe to the either or both of the above courses. You will also have detailed video explanations on how to check the Scrum, Kanban, ScrumBan, Hybrid-Scrum, Hybrid-Kanban, Hybrid-ScrumBan with these courses. 


*********

MS Project Agile/Hybrid-Agile Installation, Set-up and Run

MS Project Agile features for installed software in your computer is only available in the Online Desktop Client edition. It’s not available in any other version of the software. The MS Project for the Web, a new version of MS Project, is fully online or web-based. But it’s completely different. Hence, we will start with downloading the MS Project Online Desktop version and proceed with the below steps.

Step – 1: Know where the software is available

The software is available at the below link:

https://www.microsoft.com/en-us/microsoft-365/project/compare-microsoft-project-management-software?activetab=tabs%3aprimaryr1 

As you can see there are three plans:

  • Project Plan 1:
    • Available for free one-month trial and then nominal payment.
    • This plan does NOT have Online Desktop Client.
  • Project Plan 3: [Use this plan]
    • Available for free one-month trial and then a bit more nominal payment
    • This version has an Online Desktop Client as shown in the column (check the next figure). 
  • Project Plan 5:
    • This plan also has an Online Desktop Client. 

You can learn more on these plans at the below link:

https://www.microsoft.com/en-us/microsoft-365/project/microsoft-project-faq

Specifically, in our case, we will take Project Plan 3. This has the least cost and maximum number of features available. Also, unlike Plan 5, for Plan 3 we don’t have to contact any partners.


As you can see the Desktop Client and its features can be used on upto 5 PCs.

Step – 2: Create an account at https://office.com

The office portal the one where you have all the office related software available for download, such as MS Word, MS PowerPoint, MS Excel etc. If you don’t have an account here, you can create an account at office.com

I assume you already have licensed version of the software available. That way, you can export easily to MS Excel or MS PowerPoint from MS Project software. Yes, MS Project software has a number of features, which you can work with or export to other office software.

After you have created an account at the Office Portal and logged-in, you will have following view. 

As shown, when you login:

  • On your left side, you will have the software available such as MS Word, MS Excel, among others.
  • On your right, you can install all the software as apps.

When you have a subscription for MS Project Plan 3 software, you can use the “Install apps” command on the right and install the MS Project software. This is another way to install the software.

Step – 3: Go to https://www.microsoft.com/en-us/microsoft-365/project/compare-microsoft-project-management-software

As informed earlier, we are going to use Project Plan 3, which has the Online Desktop Client. Hence, in the link, we will use that plan.

The below view will be available for you.

In the above view, use the “Try free for one month” option (highlighted above). Later-on, you can pay to continue with the software. 

Step – 4: Provide the needed details to use Project Plan 3 

When you try free option in the previous step, it'll lead you to another page with the below view. 


There are a few steps involved such as providing your email id, verification and minimal business information. Once you are done you are subscribed to Project Plan 3!

Step – 5: Ensure to have the latest release at: https://admin.microsoft.com/AdminPortal/Home#/homepage 

It’s a good idea to have the latest release available for your software. The software gets updated frequently and with the latest release, you will have the latest features available. 

In the above link (https://admin.microsoft.com/AdminPortal/Home#/homepage), you will have the following view. 


In the above view, go to Settings > Org settings, which are highlighted. Here, we can have the latest software release setting.

In the Org Settings, select Release preferences under the Name column, as shown below. 

As you click on Release preferences, you will have the following view.


Ensure that the checkbox of "Targeted release for everyone" is selected. 

Now, you are fully ready to download the software and install.

Step – 6: Go to https://portal.office.com/account#installs

As you click on the above link, we will find the following view. 

It’s possible that you may get the Download option instead of an Install option. In such a case, don't worry at all. It’s perfectly fine. Just download the software. Ensure that it’s compatible with your OS.

You can go for a 32-bit or 64-bit version of this software. 

Note: If you have purchased an office edition in 32-bit, then use the 32-bit version for Project Online Desktop client. 

Step – 7: Install the Project (Plan 3) software

Do remember that you are now effectively installing a subscription version of the software, with the Online Desktop Client feature as we have seen earlier.

In other words, you downloaded the client side of the software on your desktop via online. This will look exactly like Desktop editions with a slight twist, which we will see in the final step. 

As you install the software and continue, it’ll look as shown below, post installation. 

Step – 8: Check Agile (Scrum and Kanban) Functionality

Now that the software is installed on your desktop, you can run it. 


As shown, the software is now available on Windows Start command. It’s highlighted as Project. As you run the software, the following view comes-up. 


As shown, now you have, capability to run:

  • A Traditional Project,
  • A Sprints (Scrum) Project,
  • A Waterfall project, and also
  • A Kanban Project (it can used from the Waterfall project mode)
In-depth, hands-on videos are available on how to check on such projects with Mastering MS Project Agile and/or Certified Hybrid-Agile Master Professional (CHAMP) courses.

When you click on the Sprints Project command above, you will have the following view. 

Step – 9: Check the Account Information

Finally, you can check that the installed version is Microsoft Project Online Desktop Client.  


This can be seen by going to File > Account > and checking the Product Information as shown above. This is the twist I had mentioned in step - 7 earlier. If you want to have the latest updates, have it enabled to get the latest updates for this software.

Downloadable PDF Copy 

The step-by-step guide is embedded in this post as shown below. It's detailed one and has additional instructions to set-up Project Plan 3 with Online Desktop Client (Agile) features. You can scroll to see the entire content.

As noted before, a downloadable copy of MS Project 2019/2021 online desktop software installation is available to the users of the new Agile courses.


To get more updates on MS Project software related courses and get the complete step-by-step instructions separarately, subscribe to this site (on top right corner of this site) and send a mail, from your Gmail id to managementyogi@gmail.com. 


The detailed step-by-step document is also available in GDrive. 

To access the document in PDF format with detailed instructions, use this link.


References

[1] NEW Online Course: Mastering MS Project 2019 Agile (Scrum, Kanban and ScrumBan), by Satya Narayan Dash

[2] NEW Certification Course: Certified Hybrid-Agile Master Professional with MS Project, by Satya Narayan Dash


Wednesday, September 14, 2022

Building and Analyzing Kanban Cumulative Flow Diagrams with MS Project Agile


Like Sprint or Release Burndown charts in Scrum, cumulative flow diagrams (CFDs) are frequently used in projects using a Kanban framework. This is because one of the fundamental aspects of Kanban is this: Manage the flow. With a cumulative flow diagram, we can manage the flow of work.

Imagine an Agile development team is delivering a number of features on-demand. The team is following a Kanban mode with Testing being a workflow state. If the team has many features developed, but is waiting to test, then the development band/state in the Kanban board will be narrow, and the testing band will be wide. A cumulative flow diagram assists.

The content of this article has been taken from these new courses:


The Cumulative Flow Diagram Basics *** UPDATED ***

A Kanban cumulative flow diagram shows work in progress in the Kanban board. As the name indicates, it is a flow diagram and is cumulatively represented. It gives insight into how many items are completed, how many items are remaining, and where the bottlenecks are in the process flow.

In the CFD below, I’ve taken the cumulative diagram for the number of issues coming to the development team on a weekly basis. There are three workflow states: “TODO,” “DOING,” and “DONE.”

Let’s interpret the diagram. Obviously the TODO items are getting added up at a faster rate, whereas the DOING and DONE are not able to catch up. TODO items in the graph are getting widening, and just below that, the DOING flow state is shown as narrower. This means that the bottleneck is in the DOING flow state. Also, the team is not able to move the DONE items well, either. From a technical standpoint, it may suggest that the items taken on may need to be broken up, or it may be possible that the team is unable to deliver on the issues taken up. 

To understand more on how a CFD can help in finding the bottlenecks, you can refer the below video [duration: 03m:39s]. It's taken from ACP Live Lessons, Guaranteed Pass course. For the best experience, you may want to go full-screen in HD mode and plug-in your earphones.


With these basics, let's check our project scenario. 

Our Project Scenario
Our project is that of house renovation work, which is being done within the Kanban framework. There are a number of work items to be completed in the backlog, some in progress, and some done, as shown below in the Gantt Chart view.


We have planned for the capacity available for the team; however, some of the items are not planned at all.  This can also be seen in the Task Board view (or the Backlog Board) view by going to View tab > Task Views > Task Board > Task Board command.
 
As shown in the above figure:

  • A couple of work items are in “Done” and “In Progress” states
  • One work item is in “Next up” state. 
  • A number of items are in the Kanban Backlog state.

The project’s Status Date has been set for Monday, September 19, 2022, which is one week ahead of the Project’s start date. For this scenario, we are going to build our cumulative flow diagram from scratch.

Building a Cumulative Flow Diagram
To create a CFD, first we have to go to the Report tab > View Reports group > New Report command and choose Blank report. The dialog box opens, and the report named, Kanban Cumulative Task Flow Report, as shown below. 


Kanban Cumulative Task Flow Report
To create the first-cut of the CFD, we go to Report tools > Insert > Chart command and insert an Area chart.
 

As you insert the chart, you will have your first view of a cumulative flow diagram with two fields:

  • Remaining Actual Tasks shows actual tasks remaining over the timeline of the project and is highlighted with a blue color. 
  • Remaining Tasks shows tasks remaining over the timeline of the project and is highlighted in an orange color.

This is depicted below with the number of tasks in the Y-axis and the timeline by date in the X-axis. 


Next, we are going to customize this chart to provide more clarity and understanding.

Customizing a Cumulative Flow Diagram

To customize the chart, I’ll enlarge the chart area, add the data labels for both Remaining Actual Tasks and Remaining Task fields, and apply associated color coding to have more visibility. You can learn how to do such steps in this article on Sprint Burndown and Burnup Charts.

After you customize the chart, it’ll be as shown below. 


Note:
  • Data labels have been added for both Remaining Actual Tasks and Remaining Task fields.
  • Data labels have been formatted for both these fields, with light orange and light blue colors, respectively.
  • The Remaining Tasks start with a value of twelve and go down to zero when the project ends.
  • The Remaining Actual Tasks start with a value of twelve and go down to ten as on the Status Date, which we have set earlier.

Now, the main part is the analysis of this data according to the Status Date:

  • The Remaining Tasks are eight, whereas the Remaining Actual Tasks are ten.
  • It means we are not actually completing tasks as we have expected or planned.
  • We can see that we are somewhat behind our planned progress.

While this CFD shows the cumulative task flow report and informs on the progress of the tasks, it doesn’t inform on what is happening at the board level. In the earlier part of the article, I stated, that with CFD, we can find out where the bottleneck is in our workflow. We need to find out where the bottleneck is at the board level.

For that, we will use another cumulative flow diagram. There can be a number of variants, but we will focus on task workflow across the column states of the Kanban Board.

Cumulative Flow Diagram – Board Status
To change the above CFD into a chart with Board Status, we have to apply the built-in grouping available in MS Project: Board Status.

We can rename this report in the Organizer by going to Report tools > Design tab > Report group and using the Manage command, or we can create a new CFD report entirely. Let’s create a new report and following the previously mentioned steps. The new “Kanban Cumulative Flow – Board Status Report” is shown below:

 
To create this report, we had to apply the “Board Status” built-in group. This can be done by going to the Field List command pane (as you select the chart area) and changing the Group By setting to Board Status (under Tasks). It’s highlighted in the figure.
Next, I’ll customize this chart by adding, formatting, and adjusting the data labels, etc. See below.

Let’s interpret the above figure, as of the Status Date of September 19, 2022:

  • The work items in the “Done” board state (at the bottom of the chart) are progressing properly.
  • The work items in the “In Progress” board state (just above the “Done” state) are also on track.
  • The work items in the “Kanban Backlog” board state are not moving as expected.
    • For this board state, the Remaining Tasks are highlighted in light blue, and the Remaining Actual Tasks are highlighted in green.
    • As on the Status Date, the Remaining Tasks are seven, but the Remaining Actual Tasks are five in number.

Looking at the above CFD, one can say that movement of work items is not happening from the “Kanban Backlog” state to the “Next up” state. The “Next Up” board state is also having a narrower band. Hence, the bottleneck is there.

There can be many possible reasons for it. A few are listed below:

  • Perhaps the team is behind on analysis to be done before moving the tasks from the “Kanban Backlog” state to the “Next up” state.
  • Maybe the team has been occupied by some other work, hence the items from the “Kanban Backlog” state are not being moved out faster.
This has to be analyzed by the project manager (PM), the Kanban Flow Master, or whoever is in a similar role. Kanban explicitly doesn’t prescribe a particular role, but indicates respect the current roles, responsibilities, and titles.

Determining the ‘Work in Progress’
Another advantage of Kanban CFD is the ability to determine the work in progress (WIP) for the project. This is in-line with another fundamental aspect of Kanban: Limit the work progress.
Let’s do a little bit more customization for the above chart by keeping only the Remaining Actual Tasks in the view. I’ll also change the date range from project Start Date to Status Date below: 


As shown, we can now quickly determine the total number of work items in progress:
  • Done state = 0
  • In progress state = 2
  • Next up state = 1
  • Kanban Backlog state = 7
Hence, the following is true:

WIP = 0 + 2 + 1 + 7= 10

Kanban emphasizes limiting this work progress for the purpose of smoothing the process flow. The WIP limit is usually driven by the organization’s policy and can be adjusted for the project under consideration.

Demonstration and Analysis
To demonstrate the charts that we just created and analyzed, take a look at the below video [duration: 10m: 37s], which I’ve prepared in support of this article. The content of the video is from my course, Mastering MS Project 2019 Agile


Conclusion
As noted earlier, the main purpose of using a Kanban cumulative flow diagram is its assistance in managing the flow of work. Unlike Scrum, where you have Sprints, in Kanban, flow is emphasized. A CFD also helps in visualizing the workflow, understanding the work in progress, and identifying necessary process policies.
One can also use a cumulative flow diagram to analyze other Kanban metrics, such as:

  • Cycle time
  • Lead time
  • Response time
  • Little’s law, etc.

Remember to be judicious while using cumulative diagrams. For example, it does not inform how big or small the tasks are. Also, I’ve seen Kanban practitioners using the scale in X-axis on days when a high number of issues or work items are being worked upon. If you do that, you won’t get any value out of it. Another scenario is working with Hybrid-Agile projects. Some practitioners create CFDs for the entire project, which gives no value. You need to customize your CFDs only for the work items, which are pulled-based and just-in-time with an on-demand delivery pattern.

I hope that this article has given you have a fair understanding on how to work with cumulative flow diagrams within MS Project. Your comments are welcome below.

--

This article was first published by MPUG.com on 8th March, 2022. This is an updated version.


References
[1] NEW Online Course: Mastering MS Project 2019 Agile (Scrum and Kanban), by Satya Narayan Dash

[2] NEW Certification Course: Certified Hybrid-Agile Master with MS Project, by Satya Narayan Dash

[3] Online Course: PMI-ACP Live Lessons, Guaranteed Pass, by Satya Narayan Dash

[4] e-Book: I Want To Be A PMI-ACP, Second Edition, by Satya Narayan Dash


Monday, August 08, 2022

Single View – Multiple Sprint Burndowns with MS Project Agile


The Sprint Burndown and Burnup charts can be created for the current Sprint in an Agile project, as we have seen before. Some of you may now wonder: is it possible to show multiple Sprint Burndown or Burnup charts in a single view? This is because you are running multiple Sprints in your project and you want to visualize all the burndowns in a single view or report. The short answer is yes! With MS Project 2019 Agile you can. A single view of multiple burndown charts is also useful in certain scenarios.

In this article, I’ll explore how to create a number of Sprint burndowns in a single view. For example, if a project is having three Sprints, we can see all these burndown charts together.

I’ll strongly recommend that you read the previous article of working with multiple Sprints, before proceeding with this one. You also need to know how to build the Sprint Burndown chart, for which you can refer to this step-by-step article

The content of this course has been taken from two new courses. These are in-depth courses to master Agile and Hybrid-Agile with a hands-on software tool. 

We will follow a step-by-step approach to build this Multiple Sprint Burndowns in a single view:

  • Current Scenario
  • Default Burndown Chart
  • Applying the Filters and Groups
  • Customizing the Multiple Sprint Burndowns
  • Interpretation and Conclusion

Current Scenario 

In our project, we have the following scenario:

  • We have three Sprints planned: Sprint 1, Sprint 2 and Sprint 3
  • Sprint 1 is fully complete. Sprint 2 is underway and we are mid-Sprint for this one. Sprint 3 is yet to get started.
  • A number of feature items are unplanned and we may take them in some future Sprints.

The project is shown below with the Gantt Chart view. 


As you can see in the above figure, we have three Sprints (with the respective percentage complete) and for the feature items, the feature custom flag is enabled.

Default Burndown Chart

Now, we are going to create the burndown chart. For this purpose, I’ll go to the Reports tab > View Reports group > New Report and create a blank report. I’ve given the name for this report: Single View – Multiple Sprints Burndowns. 

Now, I’ll insert a Line Chart into the report for which I’ll go to the Report tools > Design tab > Insert group > Chart command and insert such a chart. 

As shown above, when you insert the Line Chart, automatically it takes two fields:

  • Remaining Cumulative Work
  • Remaining Cumulative Actual Work

Considering the filter, grouping and outline level:

  • Filtering is by Active Tasks
  • There is no grouping applied.
  • Outline level is at the Project Summary level.

Applying Filters and Grouping 

Next, I’ll change the view of the above chart and apply the in-built group: Sprint. With this the view will change as shown below. 


As shown in the above figure:

  • The chart area has been expanded. 
  • The grouping is now by Sprints. The outline level has changed to Level 1.
  • There are different lines for the fields of Remaining Cumulative Work and Remaining Cumulative Actual Work.
  • There are lines for “No Sprint”, “Sprint 1”, “Sprint 2”, and “Sprint 3”.

Customizing Multiple Sprint Burndowns

We have to customize this burndown chart showing multiple Sprints because there won’t be any data for “No Sprints” and “Sprint 3”. As I apply the filters and enter the timeline needed, we will have the following view. 


In the above view:

  • We have information for two Sprints: Sprint 1 and Sprint 2
  • The timeline has been edited to consider the time till the end of Sprint 2, which is Friday October 7th, 2022.

Next, I’ll add the data labels for the lines and with it, the following view will appear. 

Let’s interpret the above figure:

  • For Sprint the Remaining Cumulative Actual Work line is slightly orange
  • For Sprint 1, we have two lines, for which the Remaining Cumulative Actual Work line is visible. This is because the Remaining Cumulative Work line is just behind.
  • For Sprint 2, we are mid-Sprint. There are two lines for Sprint 2: The Remaining Cumulative Work is in blue color coding, whereas the Remaining Cumulative Actual Work is in green color coding. 

As you can effectively, we now have a single view of two Sprint Burndown Charts, i.e., the Burndown Charts for both Sprint 1 and Sprint 2.

Another View – Multiple Sprint Burndowns

There is another way you can also visualize the charts. For this purpose, I’ll change the Line Chart to a Stacked Line Chart. With this change, we will have the following representation.  

Now we can see 4 burndown lines for both Sprint 1 and Sprint 2 representing the Remaining Cumulative Work and Remaining Cumulative Actual Work. 

Conclusion

As noted in the beginning of this article, there are some scenarios where you might want to have a look at multiple Burndown Charts in a single view. 

There can be many reasons for it. For example, you want to know how the work had progressed in the previous Sprints and how it’s progressing in the Current Sprint. It’s also possible that some of your stakeholders may want to have such a visualization. 

I believe with this article you realize that such a chart is possible to be created, customized and presented.


References

[1] NEW Online Course: Mastering MS Project 2019 Agile (Scrum and Kanban), by Satya Narayan Dash 

[2] NEW Certification Course: Certified Hybrid-Agile Master with MS Project, by Satya Narayan Dash


Saturday, August 06, 2022

Sprint Burndown and Burnup Charts with MS Project Agile


In this article, we will learn how to build Burndown and Burnup charts using MS Project Agile. Burndown and burnup charts are two frequently and widely used charts in projects using Agile frameworks - particularly the Scrum framework. These can be generated at the Iteration (Sprint) level or Release level. You can even decide your own custom level to generate and analyze such charts.

The content of this article is directly from two new Agile courses. For in-depth understanding of MS Project Agile and certification on Hybrid-Agile, you can use these courses:

These charts are important because, in Agile approaches, emphasis is on getting the work done and having working increments in every iteration or a timebox as much as possible. For a flow-based Agile, too, the focus is on delivery (on-demand), though iterations usually don’t exist in such approaches. As I’ve explained in a previous article, flow-based Agile can benefit from cadences.

Now, let's start with a real-world project scenario. 

Scrum Project Scenario *** UPDATED ***

Our current project is building a stock trading system using the Scrum framework. We have multiple Sprints planned, but detailed planning is only currently available for the first Sprint, i.e., Sprint 1. This is depicted in the below figure. 


As shown, the first Sprint has:

  • Three feature items to be delivered within the timebox – Login to the online trading system, Create a new user, and Edit an existing user.
  • Each feature has been broken down into individual tasks with durations and resources applied.
  • All Scrum events, such as Sprint Planning, Daily Scrum, Sprint Review, and Sprint Retrospective are available in this Sprint 1’s backlog.
  • All the work items for Sprint Backlog have been associated with the Sprint 1, which is our current Sprint.
  • The Sprint 1 starts on Monday, September 12, 2022, and completes on Friday, September 23, 2022. This can be seen with the newly added columns of Sprint Start and Finish in the Gantt chart view.

For information on how to prepare a complete Sprint Backlog, you can refer to this in-depth article.

Set the Status Date *** NEW ***

The burndown and burnup charts are fundamentally progress related reports. Therefore, to have progress reported, we have to set the status date, which can be done by going to the Project tab > Status group > Status Date: command. 


As shown, we have set the status date to be Monday, September 19, 2022, which is one week after the Sprint Start date.

We need to have certain tracking done on the status date, as well. Without it, a proper Burndown or Burnup chart is not possible! As tracking occurred for the current Sprint, we have the following information with respect to the progress. The tracking will happen with respect to the status date.

In the below figure, I’ve applied my custom grouping of Sprints followed with Task Summary Names. I’ve also added the % Complete field into the Current Sprint Sheet view. I hope this will help you to more easily understand the progress of the current Sprint. 

As of the status date (Monday, September 19th), we have the following progress:

  • Feature item, “Login to the online trading system,” is 100% complete.
  • Feature item, “Create new user,” is 55% complete, whereas feature, “Edit an existing user,” is yet to have begun.
  • The Sprint 1 Planning event has been completed, and a number of Daily Scrums are also completed.
  • The cumulative percent complete for Sprint 1 is 57%, and cumulative work is 312 hours.
  • The % of completion of the work items are taken from the settings in the Board view. The corresponding board columns’ states are reflected in the Board Status column of this sheet view.

Remember, when you track the work items, you do that in the Current Sprint Board view. This is applicable for either stand-alone Agile or Hybrid-Agile environments. The corresponding Current Sprint Board view for this project will be as shown below. 


It’s time to proceed to the Burndown Chart creation.

Building a Sprint Burndown Chart

A Burndown chart shows the remaining cumulative work. You start with total cumulative work and track daily how much work you have completed or burned as compared with the status date. Hence, the name, Burndown, because you are burning down work.

A Burndown chart shows the progress of the team within the iteration. Simply put, it is a visible chart that shows the remaining cumulative work for an iteration or Sprint, if you are using the Scrum framework. You can learn more on various Burndown Charts in this article

Now, we are going build upon this report. To create the first-cut of the Sprint Burndown Chart, I’ll go to Report tools > Design > Insert > Chart command, and use the simple Line Chart. 

In this Line Chart, ensure two fields available, which are crucial for the Burndown Chart:

  • Remaining Cumulative Work: It informs the total remaining cumulative work of the Current Sprint. This is represented by the line having blue color coding.
  • Remaining Cumulative Actual Work: It informs the total remaining cumulative actual work of the Current Sprint. This is represented by the line having an orange color coding.

These fields can be selected in the Field List command pane, which is highlighted in the above figure. If this command pane is not available, enable it by going to Chart Tools > Design tab > Show/Hide group, and choosing the Chart Data command.

Apply the Filter and Group *** UPDATED ***

As we are in the Current Sprint (Sprint 1), you should also ensure that the necessary group and filter are applied:

  • The built-in group applied is Sprint group, which groups among the Sprint. Say you have three Sprints, hence in total you have three groups, with two lines for each group.
  • The built-in filter applied is Current Sprint filter, which considers only the Current Sprint work items. This is because, in a project, one can have a number of Sprints, which in turn can be associated with multiple releases.
  • Applying the filter ensures that only the Current Sprint’s work items are shown.

The applied group and filter are highlighted in the above figure. Also ensure that the level is proper. In our case, we are at level-1.

Customizing a Sprint Burndown Chart

Next, we are going to customize the report to make it readable, presentable, and understandable. As a first step, I’ll enlarge the Chart Area and add labels for both the Remaining Cumulative Work and Remaining Cumulative Actual Work lines. To do this, simply select the corresponding line, right-click, and use the Add Data Labels command.

This will add the data labels to the lines, which will be in hours because units for the Remaining Cumulative Work and Remaining Cumulative Actual Work are in hours.

After you add the Data Labels, your chart will show as the below figure. You’ll want to format the Data Labels next. To do so, select any one of the Data Labels (which will select all of them). Then, right-click and select the Format Data Labels command, as shown below. 

Next, in the pop-up Format Data Labels command pane, ensure the correct label positions by going to Label Options > Label Positions. The positions will be as follows:

  • Below the line for Remaining Cumulative Work.
  • Above the line for Remaining Cumulative Actual Work. 


In addition, I’ve done a bit more formatting with color coding:

  • For the Remaining Cumulative Work, the labels have light blue color coding.
  • For the Remaining Cumulative Work, the data labels have light orange color coding.

This can be done in the above Format Data Labels command pane, by going to Label Options > Fill > Solid Fill and choosing appropriate color coding. This step ensures populated values are not only properly visible, but also clearly associated.

Finally, our Burndown Chart for the Current Sprint, will show as below. 

In the final cut of the Sprint Burndown Chart, I’ve also renamed the report, “Current Sprint Burndown Chart.”

In this chart:

  • The work is progressively getting burned down over the duration of the Sprint.
  • The planned/ideal burndown is depicted via the Remaining Cumulative Work line, whereas the actual burndown is depicted via the Remaining Actual Work line.
  • After the status date, there has been no tracking. Hence, the Remaining Cumulative Actual Work line is parallel to the time axis.
  • However, the Remaining Cumulative Work line continues to slide further and finally meets the time axis on the final day of the Sprint.

Building a Sprint Burnup Chart *** UPDATED ***

Unlike a Burndown chart, a Burnup chart shows work complete or total cumulative work complete as of the status date. You may also want to show the scope creep – scope that is changed, but not committed. You can learn more on Iteration Burnup Charts in this article.

To create a Burnup Chart from scratch, again we have to go to the Report tab > View Reports group > New Report command and choose Blank report. The subsequent steps will be similar as for the Burndown chart, except for two key changes:

  • Instead of Remaining Cumulative Work, you’ll want to have Cumulative Work, i.e., the amount of work planned to be completed as of the status date.
  • Instead of Remaining Cumulative Work, you’ll want Cumulative Actual Work, i.e., the amount of actual work completed as of the status date.

These fields can be selected from the “Field List” command pane as shown below: 


While customizing the Current Sprint Burnup Chart, one needs to follow the exact steps that we followed for the Current Sprint Burndown Chart. The final Sprint Burnup Chart is shown: 

As you can see, the report is based on the status date. In this Line Chart, we have two crucial fields:

  • Cumulative Work informs the total remaining cumulative work of the Current Sprint. This is represented by the line having blue color coding.
  • Cumulative Actual Work informs the total remaining cumulative actual work of the Current Sprint. This is represented by the line having an orange color coding.

Just below the lines, I’ve also added the Data Table for the chart. In some cases, this gives clarity with respect to work hours on every day of the Current Sprint. As you can see, after the status date, there is no update to the cumulative actual work. 

Demonstration and Analysis

To provide more clarity on these charts, I’ve prepared a demonstration on what we have learned so far. It’s explained in the following video [duration: 9m: 14s]. The content is taken from my new course, Mastering MS Project 2019 Agile. For the best experience, you may want to go full-screen in HD mode and plug-in your earphones.


Conclusion

Burndown and Burnup charts are widely used by Lean-Agile teams to visualize work remaining and work completed, respectively. The MS Project tool with its Agile features has a number of additional functionalities available to work such charts:

  • The reports can be exported to PDF files, which is quite useful if stakeholders don’t have MS Project installed.
  • One can have Burndown/Burnup charts not only for work, but also for tasks, cost, among others.
  • With the Sprint Task Burndown Chart, you can see the remaining tasks over time for the Current Sprint. You can also create the Task Burndown Chart for the entire project.
  • Create a Custom Burndown Chart with custom date ranges, which helps to identify the tasks or work completed within the desired date range.
  • For a Hybrid-Agile project, you can create the Burndown or Burnup charts for the Agile and predictive parts, separately. You can also have a combined view of the Burndown/Burnup chart for the entire Hybrid project.

I hope this article gave you a detailed understanding of working with the Sprint Burndown Charts using MS Project Agile features.

The last couple of years have been quite difficult with a lot of suffering for many around the world due to the Covid19 pandemic. I wish all my readers, around the world, a very happy 2022. May it bring happiness and joy to all of our lives.

--

This article was first published by MPUG.com on 27th December, 2021. This is a refined and updated version.

References

[1] NEW Online Course: Mastering MS Project 2019 Agile (Scrum and Kanban), by Satya Narayan Dash

[2] Online Course: PMI-ACP Live Lessons, Guaranteed Pass, by Satya Narayan Dash

[3] e-Book: I Want To Be A PMI-ACP, Second Edition, by Satya Narayan Dash

[4] NEW Certification Course: Certified Hybrid-Agile Master with MS Project, by Satya Narayan Dash