Showing posts with label Practical RMP. Show all posts

Wednesday, June 26, 2024

Practical Risk Management with Primavera Risk Analysis – Working with An Oil and Gas Industry Project


The Practical RMP with Primavera Risk Analysis course is used by risk management practitioners around the world, including PhD candidates pursuing their doctorates. Professionals from construction, software, EPC (engineering, procurement and construction), space and other industries use this course.

Currently, I received questions on its usage on in the oil and gas (O&G) industry. The question is on practical applicability in that industry. The Practical RMP course is industry transparent and uses its own project and builds-up step-by-step from risk planning, identification to risk monitoring and tracking. Along with the theory, you will learn to do risk management in a practical, hands-on manner. The later part, hands-on, is crucial. Above all, you can apply your learning in any industry.

Coming to the Oil and Gas industry, the Practical RMP course can be used and the risk management concepts can definitely be applied. For this article, I’m going to take a sample risk management plan. This is a .plan file as called in Primavera Risk Analysis (PRA) software tool. 

The .PLAN file

This plan is taken from the provided sample plans available in PRA tool. When imported to the software, it pops-up a message about cost uncertainty in this oil and gas project. 

Uncertainties can come in various ways:

  • Duration uncertainty
  • Cost uncertainty
  • Network uncertainty, among others.

You can learn more on these uncertainties in this article. All these uncertainties can be modelled

Analyzing the .PLAN file 

Now that we have imported this file, we need to have a quick look on the plan, which is shown below. 

As shown:

  • We have a number of activities under the heading “A” such as Civils, Buildings, Structural Steel & Painting, Mechanical Equipment Supply etc.
  • Each of these activities have the cost shown – minimum fixed cost, maximum fixed cost and most likely fixed cost.
  • For example, the ‘Structural Steel & Painting’ activity has minimum fixed cost of $900,000, maximum fixed cost of $1,100,000 and most likely fixed cost of $1,300,000.

The resources are fixed cost for these activities and the cost uncertainty has been shown for each. The default probability distribution has been used for them. 

The overall project statistics is shown below. This is can be seen by going to Plan menu > Plan Information … > Statistics tab.  


As you can see, the total planned cost is $19.123 M (million) and the planned finish is 31 October, 2025. I’ve changed the date of the plan. Also, you would have noticed that there are 7 resources, in total, for this cost plan.

Risks as Part of the .PLAN file

This plan is somewhat different compared to the other sample plans available. This is because the risks are added as part of this cost plan

The risks have probabilities associated, along with modelling numbers. This is because only risk can have uncertainties as they are in the future and they are uncertain. Activities are planned and will be executed. But they do have uncertainties and hence the modelling.

The risks associated with this cost plan along with the probabilities are shown in the below figure. 

As shown above three risks are directly plan of the plan, not the risk register! There are:

  • Material supply problems with 10% chance.
  • Key personal availability with 25% chance.
  • Design complexity underestimated with 20% chance.

In addition, each of these risks has minimum, most likely and maximum fixed cost. 

Running the Cost Analysis

Next, with this available plan (I’ve made some changes), we will run the risk analysis with respect to cost. This can be done by going to Risk menu > Run Risk Analysis … option. We will use the default parameters while going through analysis and will use the Monte Carlo simulation.

Post analysis, the Latin-Hypercube simulation (a modified version of Monte Carlo), we have the following representation.  

Analyzing the above report, one can say the following:

  • The chance of meeting the estimated planned budget of $19.123 is hardly 11%.
  • To have a 50% chance the budget has to go up and it has to be $19,679 M. In order to have 100% chance, the budget has to be $22, 249 M.
  • Do note that the risks are included in the analysis and they are also impacting the final cost.

Conclusion

As we just learned, any kind of O&G project can be used for risk analysis using the Primavera Risk Analysis software tool. This is a special and advanced project with only the cost aspects. For duration too, the PRA software can be used.

You need not have any apprehension about it. If you are keen to learn detailed and end-to-end risk management with a software tool, then Practical RMP course is the right fit for you.


References

[1] Online Course: Practical RMP with Primavera Risk Analysis, by Satya Narayan Dash. 

[2] eBook: I Want To Be A RMP, 2nd Edition (Updated), by Satya Narayan Dash.


Sunday, January 28, 2024

A Practical Risk Breakdown Structure with MS Project and Primavera Risk Analysis (PRA)


In the earlier article, I wrote about various Breakdown Structures and specifically, the Risk Breakdown Structure (RBS). As noted in the previous article, breakdown structures are progressively decomposed into greater levels of detail.

But then the following questions come-up?

  • How does that happen practically?
  • How does the RBS level (Level n) be associated with the identified risks?
  • What is its usage as you proceed with risk management?

To know these, one needs to know how an RBS is prepared in a practical manner with a hands-on software tool. In this article, I'm going to use the Primavera Risk Analysis (PRA) software. 

The content of this article has been taken from this course: Practical RMP with Primavera Risk Analysis

Now, let’s see the various steps and its role in risk management in a hands-on manner. 

Step – 1: Create the Plan

I’ve a simple plan created with MS Project (MSP), which is shown below. It has a couple of work packages and associated activities.  


Next, I’ll take this plan and import it into the Primavera Risk Analysis (PRA) software. After the import, it’ll look like the following one. 


As you can see, this plan in the PRA is an exact reflection of the previous plan in MSP.

Step – 2: Build the First-Cut of RBS

Now for the above plan, we are going to create the first-cut risk breakdown structure (RBS). 

To get to the Risk Breakdown Structure in the PRA software, first you have to open the Risk Register by going to PRA Menu and using Risk > Register… command. This will open the default risk register without any entry. 

From there, execute the Edit > Risk Breakdown Structure … command.  

As shown above, at this stage, the risk register doesn’t have any entry at all. Stay with me! We are going to add risk (s) and associate them,

Now, with the above command the RBS first view will come-up. 

As shown, the current RBS:

  • Four entries – Organizational, Commercial, Environmental and Technical.
  • Each of this entry is at Level – 1. One can add as many entries as one wants. We will see that shortly. 
  • There are commands on the right such as Insert (for insertion of new levels), Edit (to edit the names), and Delete (to delete any level).
  • Below the delete command there are left, right, top and bottom arrow marks, which are used to change the levels and indentation.  

Step – 3: Add Risks into the Risk Register

Our next step will be to add a risk into the risk register. Click the OK button in the previous screen to close the above RBS window and go back to the risk register. 

To add a risk, simply type the risk in the “Title” part/column of the risk register. The risk will be populated with ID, T/O (threat or opportunity), Probability scale and Impact scales such as schedule, cost, performance, score etc.  

As shown above:

  • We have Risk ID – 001 and it’s a threat or negative risk.
  • The default probability value is Very High (VH). 
  • The default impact scales are VH, VH and VH for schedule, cost and performance, respectively.
  • The scope has been calculated to be 72 internally with the help of PRA Risk Matrix. 

The most important one to note for this article and at this stage is this:

  • RBS is shown in the bottom right half of the above view.
  • There is no level for the RBS. In other words, the risk is not associated with any RBS level.

Step – 4: Build A Refined RBS

Next, we will go back to the RBS and add a few more levels, e.g., Scope. I’m taking scope, because in the previous step we just added a scope related risk.

Do note that:

  • RBS Level – 0 is the project level.
  • RBS Level – 1 is Scope, Political, Environmental etc.
  • RBS Level – 2 will be another one. For our case, we will take two: Scope definition and Scope Change.

You can go to any level you want. However, do ensure that it’s reasonable and not too fine-grained. Many risk management practitioners get into very low levels, which can pose problems later.

After adding the levels, the refined RBS will look as shown below. This is again drawn with the PRA software.

I’ve used the Insert, Edit, Delete and arrow commands to create this structure. For example, to move the Technical (L1 of RBS), I’ve used the up-arrow mark. To add a new level of Scope (L2), I’ve used the Insert command. To add another level of Scope definition (L3), I’ve used the Insert command and right arrow mark. 

You can click on the “OK” command to close the RBS and go back to the risk register.

Step – 5: Associate the Risk with the RBS

Next, we are going to associate the risk with Scope change (L3) of the RBS because the risk “Scope related risk” is due to the rapid scope change.

To associate with a risk, use the “…” command next to the RBS text box. This is shown below.


As you select the “…” command, the Select Risk Breakdown dialog box will be opened-up. Choose the Scope change (L2) and click on the “OK” command.  

Next, the risk in the register will be associated with this level of RBS. 

As shown in the above figure:

  • Risk ID – 001 of scope related risk is now associated with an RBS element.
  • The element is “Technical.Scope.Scope change”.
  • Technical is at L1, Scope is at L2 and Scope change is at L3.

That’s it! If you could follow these simple steps, a practical RBS can be created. And you can associate all the risks of the register with various levels of RBS.

Conclusion 

As I just demonstrated, the risk breakdown structure can be a key artifact used in Risk Management used in conjunction with the risk register. Like WBS is important to know the required deliverables, the RBS can be crucial, if you're really doing risk management.  

As WBS can be used as a communication tool, the RBS can also be used as a communication tool. The risk register with various levels of information can be exported to an excel sheet. This can be communicated with the stakeholders.


References:

[1] Course – Practical RMP with Primavera Risk Analysis, by Satya Narayan Dash.

[2] Course – RMP Live Lessons, Guaranteed Pass or Your Money Back, Satya Narayan Dash.

[3] Course – RMP 30/40 Contact Hours Online, Satya Narayan Dash.


Monday, November 14, 2022

Risk Register and Risk Report: What Are The Differences?


Risk Register and Risk Report are two key artifacts in Risk Management. Risk Report has been introduced for the first time in the PMBOK Guide, 6th edition and continues to be there in the PMBOK Guide, 7th edition. Also, the Risk Register will be used in projectsprograms and portfolios as well as in Agile management.

In fact, in the latest PMBOK Guide, 7th edition, Risk Report is informed to be one of the commonly (and frequently, emphasis mine) used reports, if you are really doing risk management. The commonly used reports noted in the PMBOK 7th edition are:

  • Risk Report, 
  • Quality Report, and 
  • Status Report. 

Needless to say, reporting is an important aspect of management.

Also, if you are preparing for the Project Management Professional (PMP) exam or Risk Management Professional (RMP) exam, you have to clearly know the contents of both the register and report. Specifically for the RMP exam, from 2022, the PMBOK Guide 7th edition (and tacitly 6th edition) will be one of your reference sources

In this article, we will see the differences between these two key project and risk management artifacts in an exercise format. We will also see in which processes the content of these two project documents are populated. 

Content of this article have been taken from the following video courses, where in-depth explanation and guidance are available:

Now, let’s start with the differences between Risk Register and Risk Report. 

Differences (Exercise): Risk Register and Risk Report

As shown below, we have a table with Risk Register in the second column and Risk Report in the third column. Try to note down the differences between the Risk Register and Risk Report on your own first, before checking the answers. 


Were you able to find out at least five differences?

Scroll down to see the answers.

. . .

. . .

. . . 


In the below table, we have the differences noted.


Next, let’s try another exercise. 

Processes (Exercise): Risk Register and Risk Report

In this exercise, we have the Process Name(s) noted in the third column. You have to inform in which process (or processes), the content of the Risk Register and Risk Report are noted.

Following are the processes in Risk Management:

  • Plan Risk Management
  • Identify Risks
  • Perform Qualitative Risk Analysis (Perform QLRA)
  • Perform Quantitative Risk Analysis (Perform QTRA)
  • Plan Risk Responses
  • Implement Risk Responses
  • Monitor Risks


I believe you have tried it first on your own, before checking the answers.

Scroll down to see the answers.

. . .

. . .

. . . 

In the below table, we have the process names noted for the contents of the Risk Register and Risk Report.


A Sample Risk Register

Below is a sample of a real risk register.


As shown above, in the Risk Register, we have Risk ID, Risk SWOT value (threats or opportunities), Risk Title, Risk Pre-mitigation parameters such as probability, impact on schedule, cost, performance etc., and risk score.

A Sample Risk Report

Below is a sample of a real risk report.


As shown above, in the Risk Report, we have information about overall project risk, the project chances of success with respect to schedule and cost with probabilistic analysis, sensitivity analysis, summary information about individual project risks, risk audit information and a summary conclusion.

You can learn more on the 
flow of risk register and risk reports, and how they are populated as they pass through the risk management processes in the following article.

Fundamentals of Project Risk Management Framework

Conclusion

In my interactions, few managers, who understand the value of risk management, use Risk Register! On the other hand, Risk Report is almost unheard of, because organizations don’t take risks seriously. It creates problems later with many change requests (CRs) or issues overwhelming the projects, programs or portfolios. Do also note that issues are risks, which have already occurred. I’ve seen many such instances and projects running into real trouble. 

When you clearly know the content of these two project artifacts and know how they are prepared, it’ll help you immensely in not only managing the risks, but also scope management, schedule management and cost management aspects of a project. 


PMP Live Lessons and RMP Live Lessons:

PMP 35 Contact Hours and RMP 30 Contact Hours:

Friday, April 22, 2022

End to End Risk Management with MS Project and Primavera Risk Analysis


Imagine you are managing a large project, which is strategically important and complex. At the outset, you realize there will be a number of risks, which if not managed well, could paralyze the outcome and have negative impacts on the project objectives. You want to proactively identify, analyze, respond, track, and monitor your project’s risks. And, it would be great to have a dedicated risk management tool to use alongside your project management software.

What are your options? Will software tools like Excel help? Will a software tool for only project management meet your needs?

If you have ever managed risks, you know a spreadsheet is not the answer. A spreadsheet is not at all designed for project management–let alone risk management. It’s likely that a project management software tool only meets your need half-way.

One of the most frustrating experiences faced by management practitioners with respect to software tools and one response was related to risk management and tracking, specifically in a scenario where spreadsheets were being used. Another aspect that came to light was the need for an integrated and risk-adjusted schedule-cost management system, which brings up questions like: what are the duration estimates and cost estimates associated with the risks? How can a PM manage risks in with a single, centralized tool?

In this piece, I’d like to present an integrated approach to project management with strong end-to-end risk management capabilities. For this purpose, I’ll be using two software tools:

  • Microsoft Project (MSP) 2019 for project management, and
  • Primavera Risk Analysis (PRA) 8.7.5 for risk management.

The practical examples and samples for this article have been taken from Practical RMP with Primavera Risk Analysis, whereas the theoretical explanations are from RMP Live Lessons.

Let’s start with creating a project plan with MS Project. 

Create the Project Plan

While you can directly use PRA to create your project plan, most project managers use MSP frequently for planning because of its simplicity, ease of use, and user friendliness.  For this reason, we will create the plan first in MS Project. The plan depicted in the below figure.

The statistics of the project are these:

  • Duration: 38 days
  • Cost: $67,680 USD
  • Finish Date: June 30, 2021 (06/30/21)

The project is the creation of a Smart Site and involves multiple resources.

Do note that if you have modified the calendars for the project and/or have added custom calendars, you’ll need to ensure you have the corresponding calendars in PRA.

Set-up PRA for Risk Management

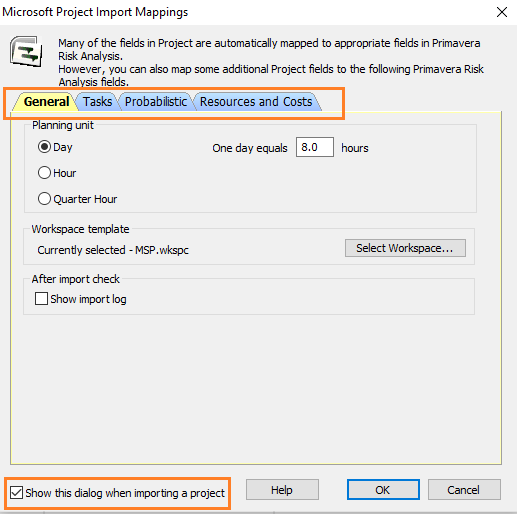
Before importing the plan, ensure that the settings for MS Project in PRA are correct. This can be opened by going to PRA tool’s File à Microsoft Project à Edit Default Import Mapping… menu.

Keep the “Show this dialog…” checkbox enabled so that when you open the MSP Plan in PRA, you can have a quick look at the settings before actual import happens.

Import the MSP Plan into PRA

Now that we have set the MSP related settings in PRA, we will import the project plan created in MSP into PRA. It will happen in a few seconds. Post import, in PRA, the plan will be shown as below.

The imported project plan in PRA has the following statistics:

  • Remaining Duration: 38 days
  • Remaining Cost: $67,680 USD
  • Finish Date: June 30, 2021 (06/30/21)

This is perfectly in sync with the statistics of our project plan created earlier in MSP. It’s also a good idea to check a few of the tasks in the project to see that the import has happened properly. In our case, the task/activity “PRD Preparation” has been considered. It matches perfectly with the MSP Plan considering Dates, Resources, and Cost, among other fields.

Important Notes

At this stage, I’ll recommend that you read this Risk Management Framework for Projects article to understand how risks are managed and monitored over various Risk Management processes. Here, I’ll be using only the Risk Register, not the Risk Report.

In addition, I’ll explain some key points with respect to risk management, which will help you to understand why I’ve taken the following steps and performed the associated activities. Take a look at the video [Duration: 4m:12s] below—it’s been taken from RMP Live Lessons. For a better experience, you may want to go full-screen with HD mode and plug-in your earphones.


Risk Identification and Risk Register

Now, we are going to prepare the Risk Register. Preparation of this key project artifact happens during the Risk Identification process.

To create the Risk Register with PRA software, go to Risk à Register… menu, or click on the Risk Register icon on the Risk Toolbar of PRA. The Risk Register creation dialog box will pop up, and we will use the standard risk register option.


When the standard Risk Register first opens, of course, it will be empty as shown below.


You can enter new risks easily by adding details for the identified individual project risks.

As you can enter the risks, provide all the needed information such as Risk ID, Threat or Opportunity, Risk Title, the Pre-mitigation information such as Probability scales, Impact Scales, etc. You can also add the Risk Details such as Cause, Effect, and Risk Category, among others.


As shown, we have four identified risks (threats) for this project with their respective details entered. The cause, effect, description, owner, RBS type, and status values have been entered for each of the risks.

Do not worry about the risk responses now. We will address them in the step for risk response planning as I explained in the earlier video. The risk score is calculated by taking the risk parameter values from the Risk Probability and Impact (PI) Matrix. For the sake of this example, I’ve used the following matrix.


The probability and impact scales notations in the Risk Register are these:

  • Very Low (VL)
  • Low (L)
  • Medium (M)
  • High (H)
  • Very High (VH)

As you multiply the probability and impact values, you will get the Risk Score. For more depth, refer to this detailed article on Risk Matrix Reporting.

Risk Qualification

Our next step is to qualify these individual risks. We will determine the probability and impact values of these risks. You can have other risk assessment parameters, as well, such as Risk Manageability or Risk Proximity, among many others.

Considering the probability and impact values of these risks, as we qualify them, the Risk Register will be updated as shown below.

As you can see, the current Risk Register has seen a number of updates. Considering Risk ID – 001, some of the key updates are:

  • Risk Score is now 21. (change from 72 to 21)
  • Risk Owner is confirmed. (John R is the confirmed owner)
  • Risk Status has been modified. (Status is “open” now; earlier “proposed”)

Similarly, we have also qualified other individual project risks: Risk 002, Risk 003, and Risk 004.

Risk Quantification

This step of risk quantification is optional, as we have seen in the RMP video. Though our project is a simple one, let’s do risk quantification for one individual risk (Risk 001: Poor understanding of design specification). After quantification of this risk, the pre-mitigated Quantified Risk Register will show as follows:


Note that Risk 001 has now been quantified from a schedule perspective by associating it with two tasks in the Project Plan, i.e. Task ID 000009 and Task ID 000010, from “Phase – 1” under the WBS element of “Design and Development Phase” at Level – 2 of the work breakdown structure (WBS).

I’ve used BetaPert probability distribution for the tasks mentioned and have entered the minimum, mostly likely, and maximum duration estimates. Similarly, you can also quantify with respect to cost estimates.

Post quantification, you can do a variety of analyzing such as:

Risk Response Planning and Response Integration

Next, we will do the risk response planning for the individual risks to bring down the probability and/or impact values of these risks. With this, we can keep the risk score within the risk threshold.

For this purpose, we again have to go to the Risk Register and modify the risk response strategies along with the associated risk response actions. The modified risk register is shown below.


Considering “Risk 004: Key resources unavailable,” the Risk Score has been reduced from 56 to 1, and similarly for certain other risks.

For Risk 004, the associated actions are noted under the highlighted “Mitigation” tab. There are two mitigation response actions:

  • Risk Response Action – 1: Get the resources from other functional departments.
  • Risk Response Action – 2: Prioritize project resources.

The assigned risk response owners and associated cost are noted. The associated cost also reflects on the top panel for Risk 004.

Risk Monitoring and Tracking

Our final step relates to risk monitoring and tracking. During risk monitoring, new risks may be identified, an existing risk status can change, an existing risk can become obsolete, or an existing risk may not occur.

Let’s say a new positive risk (opportunity) is identified, and we need to add this risk into the register. As we have seen earlier, risk management is both iterative and integrative in nature. 


As shown, we now have a new risk—“Risk 008: Reuse of previous design module.” As this risk is freshly detected, default values have been populated. The blue letter “O” represents an opportunity.

Subsequently, we have to determine the initial characteristics of this risk, followed by qualification and quantification (optional), and have the needed risk response strategies with associated risk response actions. Finally, we have to monitor this new adjusted risk with response and associated actions.

As we reach the end of this article, some of you may be thinking can this risk register be exported to MS Excel? After all, not all stakeholders will have MS Project 2019 and Primavera Risk Analysis software installed.

The answer is yes! You can export the Risk Register to MS Excel by going to Risk Register’s File à Export Risk Register As… menu. From there, while saving, choose “Microsoft Office Excel (.xls)” option to save.

With this process in mind, I believe you will have a sound understanding of end-to-end risk identification, analysis, response planning, and implementation, followed with risk monitoring and tracking.


--

This article was first published by MPUG.com on 18th May, 2021.


References:

[1] Online Course: Practical RMP with Primavera Risk Analysis, by Satya Narayan Dash

[2] Online Course: RMP Live Lessons, Guaranteed Pass, by Satya Narayan Dash

[3] Online Course: MS Project Live Lessons, by Satya Narayan Dash


Friday, December 20, 2019

Practical RMP: How to Create Risk Exposure Plans and Exposure Burnup, Burndown Charts


In risk management, you have many steps to follow from risk identification to risk monitoring. However, if you ask anyone who has done risk management in the real world, one of the key areas to manage will be the management of overall project risk exposure. The questions that one generally faces will be these:
  • Is the overall project risk exposure within acceptable limit?
  • If not, have you re-planned and developed further/other responses to reduce the risk exposure?
  • Have you implemented the risk responses in order to actually bring down the exposure?
  • Are you continuously monitoring the overall project risk exposure?

In this post, I’ll will outline four steps needed to build Risk Exposure Plans – both pre-and post-mitigated. In addition, we will see Exposure Burnup and Burndown charts. Charts being visual, give you quick information and also, is effective for stakeholder communication. 

These steps are taken from “Practical RMP with Primavera Risk Analysis” course. It’s taken from one of the practical of this course using a real-world project. I’ve also mentioned it to be one of the benefits of this course. 

Before proceeding with the steps, I assume that you have:
  1. Completed risk management planning, because risk thresholds will be set here. These risk thresholds, in turn, will determine the acceptable level of overall project risk exposure.
  2. Identified the risks, and have documented in them in Risk Register.
  3. Prioritized the individual project risks. 

Now, let’s will proceed with the steps to create the Risk Exposure Plan. 

Step – 1: Ensure Proper Settings 
First, we will start with the proper settings for the integrated Risk Management Plan created with the help of Oracle Primavera Risk Analysis (PRA) software tool. Note that going forward, all the steps will be conducted with the help of PRA tool.

To create the risk exposure plan, first set the dates on which you want to measure the exposure. It can be either Start Date (of the plan) or Data Date (status date). This can be done by going to:

Plan – Plan Information 

This will open the Plan Information dialog box as shown below. Enter the Data Date. 


Step – 2: Determine the Pre-mitigated Risk Exposure 
In this step, we will determine the risk exposure based on the current scores of the individual risks. To do so, in the PRA tool, go to:

Risk – Risk Register –Tools –Build Exposure Plan...

You can decide the form of exposure from Data Date or Risk Start Date with pre-mitigated or post mitigated probabilities. I’ve chosen the former. This is shown below. 


As shown above:
  • For Exposure Date, it will be “Apply Exposure from Data Date”.
  • For probabilities, it will be “Pre-mitigated probabilities”.

This is in line with our Step – 2, where we are determining the pre-mitigated risk exposure. Finally, click on OK button. 

This will create the Pre-mitigated Risk Exposure Plan, which is shown below. It’s a view with two panels:
  • Upper panel – Pre-mitigated Risk Exposure Plan
  • Bottom panel – Burnup Chart


Let’s interpret the data in the above plan. First, let’s take the Pre-mitigated Risk Exposure Plan in the top panel.

We have 4 prioritized risks – Risk 001, Risk 004, Risk 005, and Risk 006. (Click on the above image for enlarged view)
  • For each risk the exposure % is noted in the bar chart, e.g., Risk 001 has 23% exposure. Risk 005 and Risk 006 have 60% exposure and so on. 
  • For each risk, the exposure cost is noted along with the risk start and finish dates. For example, for Risk 001 the cost is $20,000, for Risk 002 the cost is $15,000 and so on. 

Now, let’s interpret the Exposure Burnup Chart in the bottom panel.
  • The overall exposure as on Data Date is $72,000. This is the sum of all risk exposure, i.e., combing the exposure of all prioritized risks – Risk 001 to Risk 006.
  • Obviously, the exposure has gone up over time. For example, on July 10, 2020, it’s around $35,000 whereas on July 31, 2020 it’s over $70,000. The timeline on X-axis, whereas the exposure value is on the Y-axis.
  • This results in a Burnup chart, which is shown above.

Step – 3: Plan and Implement Risk Responses and Risk Response Action 
Let’s say that the overall exposure is high (we have determined earlier during risk management planning) and we need to bring it down. Hence, we plan for Risk Responses and associate the Risk Response Actions. These will be updated in the Risk Register (and in turn also in the Risk Report, if you go by the PMBOK 6th edition). The data for the below risk register is again taken from one of the practical of this course.

Step – 4: Determine the Post-mitigated Risk Exposure 
After you have taken the risk response actions, the exposure will come down for the risks. Next, again in the PRA tool, go to:

Risk – Risk Register –Tools –Build Exposure Plan...

And build the plan for post mitigated probabilities. This is shown below. 


This will create the Post-mitigated Risk Exposure Plan, which is shown below. Again, it’s a view with two panels:
  • Upper panel – Post-mitigated Risk Exposure Plan
  • Bottom panel – Burndown Chart


Let’s interpret the data in the above plan. First, let’s take the Post-mitigated Risk Exposure Plan. (Click on the above image for enlarged view)
  • We again have the same 4 prioritized risks – Risk 001, Risk 004, Risk 005, and Risk 006.
  • For each risk the exposure % is noted in the bar chart. But now they are reduced, e.g., Risk 001 has now reduced to 8% (earlier 23%) exposure, whereas Risk 006 has 0% (earlier 60%) exposure, and so on. 
  • For each risk, the reduced exposure cost is noted along with the risk start and finish dates. For example, for Risk 001, it’s $5,000.

Now, let’s interpret the Exposure Burndown Chart in the bottom panel.
  • The overall exposure as on Data Date (11th July, 2020 which is set earlier) is $12,000. This is the sum of all individual project risk exposures. 
  • The overall project risk exposure has to go down over time. For example, on July 10, 2020, it’s around $12,000 whereas on July 31, 2020 it’s just $1,000. Again, the timeline on X-axis, whereas the exposure value is on the Y-axis.
  • This results in a Burndown chart. 

Step – 5: Monitor the Risk Exposures 
This is the final step and you continue to monitor the risks. If the probability and/or impact values of the risks change, then it will change the exposure values as well.

I hope with this you learn how to create the risk exposure plans and the related burnup and burndown charts. Of course, based on it you can create the needed reports and communicate with your stakeholders.