Showing posts with label User Story. Show all posts

Monday, June 05, 2023

Step-by-Step Closing of A Sprint with MS Project Agile

Want to master MS Project Agile? Learn in and out of it?

Course available at a very low cost: ðŸ‘‰ MASTERING MS PROJECT AGILE

The course comes with a full money-back guarantee!

The free article follows.

--

Takeaway: A Sprint is considered to be a mini-project within a Scrum project. Like every project has to be closed, a Sprint, also has to be closed. However, many Agile practitioners do not follow this practice. In this article, we will take a scenario for Sprint in a Scrum project and follow the steps needed to close a Sprint Project.

We will begin with a scenario for a project, proceed with various steps to close the Sprint within a release, and learn a variety of functionalities available in MS Project 2019 Agile. Then, I will demonstrate the closing steps. Keep in mind that closing a Sprint differs significantly compared to the closing of a traditional project with MS Project.


Our Project Scenario *** UPDATED ***

In our project, there are a number of releases, and each release has a number of Sprints. The decomposition pattern can be in a variety of ways, such as:

  • Product > Epics > Features > Iterations > User Stories
  • Product > Iterations > User Stories
  • Product > Releases > Iterations > Features
  • Product > Releases > Iterations > User Stories 
  • Product > Features > Releases > Iterations > User Stories
  • Product > Features > Epics > Iteration > User Stories, among many others

In our case, the pattern will be: Product Backlog > Project > Releases > Sprint/Iteration > Features > Tasks. This is to maintain consistency with my earlier piece on Agile release planning. If you are working with any other decomposition pattern, you can still follow the steps laid out in the below video [duration: 4m:55s]. I’ve prepared the video in support of this article, so that readers will have understanding of the scenario. For the best experience, you may want to go full-screen HD and plug-in your earphones.


When using MS Project with its Agile features, the following depiction is visible in the Sprint Planning Sheet view. This view shows multiple releases within a project and multiple Sprints in every release. 


You may be wondering about the empty Resource Names column. It’s empty because resources are assigned to tasks, not the Releases, Sprints, or features. The features (or stories) will be summary tasks because they are finally broken down to tasks, to which resources will be assigned.

Specifically, for Sprint 1, which is under consideration in our case, we have the following view using the Current Sprint Planning Sheet view. 

In the above figure, I’ve applied a custom grouping: Sprint and Features. This enables a better visualization. I’ve also added the % Complete in-built column.

Looking at the above figure:

  • Sprint 1 has three features: ‘Login to the online trading system’ (100% complete), ‘Create a new user’ (100% complete) and ‘Edit an existing user’ (40% complete).
  • The feature of ‘Edit an existing user’ has a number of incomplete tasks, as the Scrum team could not complete these tasks.
  • The Daily Scrum events are not all complete. Hence, the summary task of ‘Daily Scrum’ is shown to be 88% complete.

Set the Status Date *** NEW ***

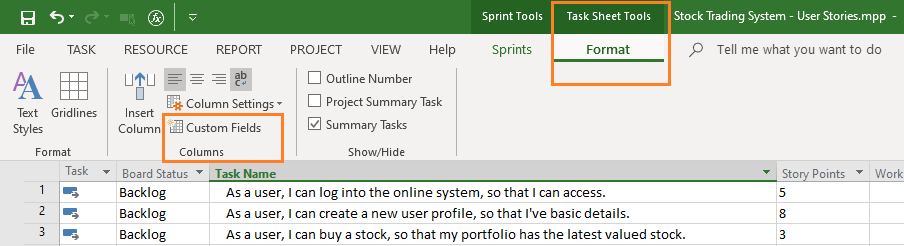
This update is as on the final day of the Sprint, i.e., September 23, 2022. The status date can be set by going to the Project tab > Properties group > Project Information dialog box and setting the ‘Status date:’ field.


You can also set the date by selecting ‘Status Date: command’ under the Status group of the Project tab. Some practitioners find this way to be quicker.

As you complete the task items, or move the items across the workflow states, it’s likely that some of the items will remain in a Not-Done, or unfinished state. Items with unfinished status can be tracked in ‘Sprint Backlog,’ ‘Next Up,’ ‘In Progress,’ or any other custom state or column you define. This situation leads us to our next step.

Move the Incomplete Items to Next Sprint

The tasks or items which are planned for the current Sprint, but could not be completed, are usually moved to the next Sprint. This can be done in the Current Sprint Board view. 


As shown above, we have a number of tasks under the feature, ‘Edit an existing user,’ in the Sprint Backlog. All these incomplete tasks should be moved to the next Sprint by selecting the task item and choosing the ‘Move to Next Sprint’ command after right-clicking. This has to be done for all incomplete tasks.

Check the Daily Scrums

Incomplete Daily Scrum events need to be closed. Otherwise, they will remain on the Board and Sheet views, which may create problems while managing and tracking the next Sprint.

For a two-week Sprint, there will be a number of Daily Scrums, as explained in the article, Building A Sprint Backlog with All Scrum Events in MS Project Agile. To complete these events, enable the filter option in the Current Sprint Planning Board view.

The filter option is available at the far-right part of the board view. Select the ‘Daily Scrum’ summary task to display all the Daily Scrum events, as shown below. 


With the filter applied, the incomplete Daily Scrum events will be visible in the board view. Select the incomplete ones and simply move them across to the Done state.

Complete All Sprint Events

Other than the Daily Scrum event, there are events such as Sprint Planning, Sprint Review, and Sprint Retrospective. The Sprint Planning event happens on the first day of the Sprint. By this time, the event should have been closed. If it’s not done already, you must close this event’s associated task.

However, the last two events of Review and Retrospective happen on the final day of the Sprint. It’s easy to forget to close these two events as the current Sprints ends, and the next immediately starts.

These last two events can be closed in the Current Sprint Board view. 


As shown, we now have only two tasks in the Sprint Backlog workflow state: the events of Sprint Review and Sprint Retrospective, which are highlighted. These events can be closed by dragging and dropping them into the Done column.

Ensure the Sprint’s Completed Features

At this stage, all tasks have been closed or have been moved into the next Sprint, if they remain incomplete. We have also closed various Sprint events. Now, it’s a good idea to review the features with the associated task to ensure that the percent completion is 100% at the overall Sprint level.

This will look like the figure below, in the Current Sprint Sheet view. At the highest level – after applying the grouping for the Sprint – we have 100% completion for the entire Sprint. 

Note that for the ‘Edit an existing user’ feature,’ we have only one completed task: ‘Design and develop.’ Remaining tasks have been moved into the next Sprint, which in our case is Sprint 2. This synchronizes with the previous step and confirms that it is complete.

  • After completing this step, you may have the following questions:
  • Where can one see the tasks (associated with features) moved into the next Sprint?
  • Are the tasks properly placed as part of the next Sprint?
  • Are the tasks properly associated with the Release?
  • Will the workflow state (anything other than Done state) be preserved when moved into another Sprint and Release?

To answer the above questions, we will move to the next step.

Review the Sprints within a Release

The Sprint completion within a release can be confirmed with the Sprint Planning Sheet and Sprint Planning Board views. In MS Project, when a Sprint gets completed, both the Sprint and Sprint work items are removed from these Sheet and Board views. Though it may be confusing initially, in fact, it’s quite logical: because the Sprint has been completed!

For our case, the current release plan after Sprint 1’s completion is shown below in the Sprint Planning Sheet view. This not only ensures that the concerned Sprint (Sprint 1) has been completed but also ensures its reflection in the release plan. 

As shown:

  • Sprint 1 items are complete. Hence, the Sprint and its associated items are not reflected in the Sprint Planning Sheet view. However, you can change the built-in filter to display the items.
  • The tasks under ‘Edit an existing user’ feature are now part of Sprint 2. These items are highlighted under the Task Summary Name column.
  • The other feature items such as ‘Buy a stock’ and ‘Sell a stock” were previously planned to be part of Sprint 2, and they are highlighted.
  • The Feature flag is showing as enabled for both of the above two feature work items, whereas the flag is disabled for the task items moved from Sprint 1.
  • All the tasks are not only properly associated with the next Sprint (Sprint 2) but also with the release (Release 1).

You can also cross-verify this in the Sprint Planning Board view, which is shown below. The Sprint 1 column in this view is now completely empty. 

In MSP, it is by design that a completed Sprint is not available in the Spring Planning Board. This is because in both the Sprint Planning Board and Sprint Planning Sheet views, the filter applied is Sprint Planning Filter.

If you want to see all the Sprints plus all the associated features and tasks with % completion, you can customize the filter and apply it to the view or create another custom view. The video below explains this process in more detail.


Plot the Velocity Histogram *** NEW ***

Another practice that is followed by Agile practitioners using MS Project is to build a Velocity Histogram. The velocity histogram is one of the most used reports used by Scrum Masters, Product Owners or Agile Project Managers – the last one considering Hybrid Agile project.

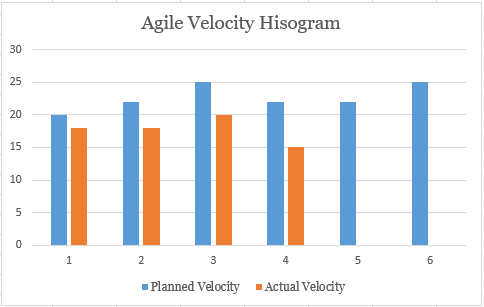
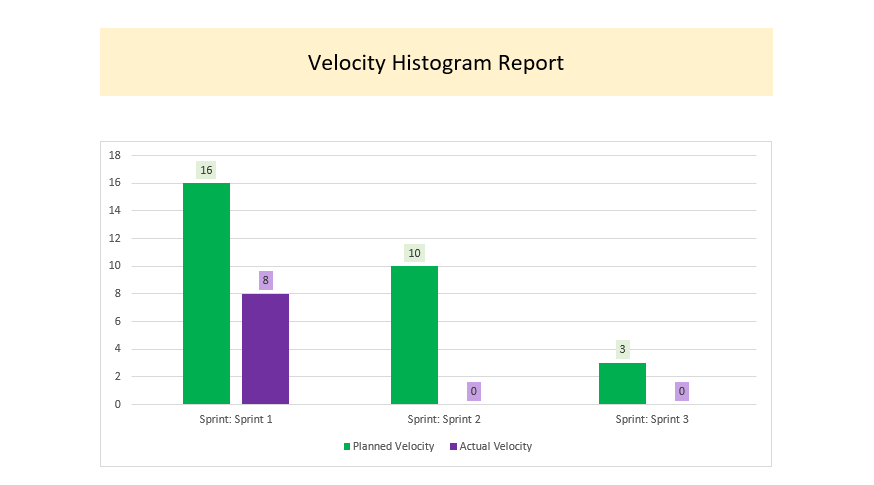
Velocity histogram is a vertical bar chart with a pair of bars showing velocity metrics over a series of Sprints. The first part of the pair is usually the planned velocity, whereas the second part of the pair is the actual velocity.  When plotted together, one can quickly infer and interpret the data, which can also be used for forecasting. A sample velocity histogram is shown below. 


You can learn more about building the velocity histogram in this article.

Demonstration, Review and Analysis

We covered the major steps to close a Sprint for a Scrum project. Now we will demonstrate, review, and analyze the steps that we have learned so far. The below video [duration: 6m: 21s] is taken from my course, Mastering MS Project 2019 Agile, and explains how to close a Sprint in more detail.

Conclusion *** UPDATED ***

Closing a Sprint is an important step that should be done diligently by the Agile Project Manager or the Scrum Master.

Leaving the tasks and events open, directly updating the % Complete column field for the tasks without moving the tasks across the board, or updating the previous Sprint’s tasks in the current Sprint creates confusion for your team members. It also results in wrong reports, such as the Velocity Report, Burndown Chart, or Burnup Chart. More importantly, your plan will no longer be correct.

It’s also pertinent to note that only the features which are completed will count towards velocity, not the ones which are partially complete. Even one task item remaining incomplete should not count toward velocity. If you are using stories and story points to estimate for planned and actual velocity, then your project plan should have the proper velocity calculation in MS Project.

Everything you need to close a Sprint for a Scrum Project is available at your fingertips with MS Project. Go ahead and close your Sprint rapidly and elegantly…and sprint for the next Sprint!

--

This article was first published by MPUG.com on 11th October, 2022. This is an updated version.


References

[1] Online Course: Mastering MS Project 2019 Agile (Scrum, Kanban and Scrumban), by Satya Narayan Dash

[2] Certification Course: Certified Hybrid-Agile Master Professional (CHAMP) with MS Project, by Satya Narayan Dash


Monday, April 17, 2023

Building A Velocity Histogram with MS Project Agile


Like velocity is one of the widely used metrics in Agile, the velocity histogram is one of the most used reports used by Scrum Masters and Product Owners. It’s simple, effective and acts as an information radiator.

I frequently interact with professionals who use my CHAMP certification course or Master Course for MS Project Agile. This came as a question from one of the aspiring CHAMPs and hence this post. Before getting into this article, I’d definitely suggest that you read the below two:

To download and use the MS Project Agile, you can use the following step-by-step installation guide.

Step-by-Step Guide: Install, Set-up and Run MS Project Agile

 Now, let's start with the histogram basics.

Histogram Basics

Histograms are widely used by management practitioners – product, program, portfolio or otherwise. It can defect histogram, resource histogram, earned value measurement (EVM) histogram, among others. 

Simply put, it’s a graphical representation of numerical data, and it’s usually a vertical bar chart. Nevertheless, variations exist. 

Considering Velocity Histogram, it’s a vertical bar chart showing two bars for every Sprint in a release and/or project. While one bar is for the Planning Velocity, the other one is for Actual Velocity. A simple velocity histogram is shown below. 


Use A Histogram Template

To create a new velocity histogram using MS Project Agile:

Go to the Reports tab > View Reports group > New Report > Chart. 

As shown above, the chart selected has a histogram figure and it’ll create a histogram with certain default fields. 

In the popped-up Report Name (shown below), enter the report name as Velocity Histogram Report. This will create the report with three default fields:

  • Actual Work
  • Remaining Work
  • Work


As you’d have correctly guessed, we are not going use to these fields, but MS Project Agile will have these fields. We are going to change these fields in a moment. 

Removing the Histogram’s Default Fields

As you can understand, velocity has nothing do with the fields of Actual Work, Work or Remaining Work. Hence, we have to remove these fields. To remove these fields, select the chart area of the created report, right click and use Show Field List command from the drop-down menu. 


Now, in the right pane of Field List, we have the individual fields of Actual Work, Remaining Wok and Work. Right-click on them one-by-one and use the Remove Field command to remove those fields. Now the chart area will be completely empty. 


Customizing the Histogram with Velocity Fields

Next, we are going to customize this histogram (completely empty) with the needed fields. As we have seen earlier and mentioned in the two linked articles of this post, we need only two fields:

  • Planned Velocity: The velocity planned for the Sprints across the releases or the entire project.
  • Actual Velocity: The determined actual velocity for the Sprints across the releases or the entire project.

We are going to make use of those fields now.

In the right pane of Field List:

  • Go to the Number field.
  • Go to the Custom field under Number field. 
  • Choose Planned Velocity and Actual Velocity, both custom number fields.  


As you can see in the above figure, we now have Planned Velocity and Actual Velocity fields available in the chart area of our histogram. Next, change the Grouping the field list to Group by: Sprint. This will result in the following view. 


Removing the Non-Sprint Columns

As you’d have noticed above, there is a non-Sprint column and we don’t need that. To do so: 

  • Select the chart area.
  • On the right-hand side three small icons will come-up. Select the last Filter (Funnel) icon.
  • In the popped-up Values pane, deselect the category of Sprint: No Sprint.
  • Click on the Apply button below. 


With it, we will only the data related to Sprint 1, Sprint 2 and Sprint 3. If you have planned for more Sprints, then those data will also be available. 

Adding the Data Labels 

Now that we have the needed fields and only Sprints’ related velocity data, let’s customize the available velocity histogram a bit more. For this purpose, select the vertical blue bar (for planned velocity), right click, and select Add Data Labels as shown below.  

Similarly, select the other vertical orange bar (for actual velocity), right click and add the data labels. With these changes, as you can see, our first cut of Velocity Histogram for the three planned Sprints (Sprint 1, Sprint 2 and Sprint 3) is available.  

Interpreting the above figure, you can see the planned velocities for Sprint 1, Sprint 2 and Sprint 3 are 16, 10 and 3 respectively, whereas the actual velocities for Sprint 1, Sprint 2 and Sprint 3 are 8, 0 and 0, respectively.

Customizing the Data Labels 

Next, let’s customize this chart more with the color coding changes. As we make a few more adjustments, you will have the following view. 

To generate this report, I’ve:

  • Filled the vertical bars with different colors.
  • Formatted the data labels with a lighter version of respective colors.
  • Filled the color coding for the report label: Velocity Histogram Report.


Conclusion

MS Project Agile comes with a large number of reports, which you can use to your advantage. For example, this chart can be created in a matter of seconds, if you know the software tool well. 

Also, you don’t have to update the Velocity Histogram as you keep completing the Sprints and sprint for upcoming Sprints. The histogram will take the latest data and reflect them in the report. 


As shown in the above figure, we now have the inputs from Sprint: Sprint 2 and they are reflected in the Velocity Histogram report. 

And of course, you can export to a PDF format to share it with other stakeholders, team members and make them available as part of your project repository. 


References:

[1] Book: I Want To Be A PMI-ACP: The Plain and Simple Way, by Satya Narayan Dash

[2] Master Course: Mastering MS Project Agile, by Satya Narayan Dash

[3] Video Course: Microsoft Project Live Lessons, by Satya Narayan Dash.


Thursday, April 13, 2023

Calculating Velocity with User Stories in MS Project Agile (Scrum)


Velocity is a widely used metrics by Scrum practitioners, though velocity is not specifically mentioned in the Scrum Guide, 2020. With MS Project Agile software you can have this metric quite quickly, if you are working with user stories and story points. 

This came as a question in one of the recent international webinars, where participants wanted to know on the applicability of velocity. As per the question, the development is happening with work items estimated in stories, and they are not breaking them down into individual tasks. Can velocity be calculated in such a scenario?

You can watch the webinar and related questions here:

Practical Scrum using MS Project Agile (3 of 3) by MPUG

To answer the question on velocity: yes, absolutely you can have velocity metrics in MS Project Agile! In this article, we learn about this capability. To download and use the MS Project Agile, you can use the following step-by-step installation guide.

Step-by-Step Guide: Install, Set-up and Run MS Project Agile 

In-depth explanation with Velocity, User Stories, Velocity Histogram, Release Histogram etc. are explained in the following course:

Mastering MS Project Agile – Scrum, Kanban and ScrumBan

Important Note: Before proceeding further with this article, I’d strongly recommend that you understand the basics of User Stories and Story Points and how they are used with MS Project Agile (Scrum). The link is below:

Working with User Stories and Story Points in MS Project Agile (Scrum)

Velocity Basics

Velocity is simply the sum of stories delivered at the end of the Sprint, considering you are using the Scrum framework. There are no complicated formulas to calculate. Simply add the number of story points! 

Let’s take an example to understand.

You have three work items planned for the upcoming Sprint 1, estimated with following story points:

  • Work item 1:  5 story points
  • Work item 5: 8 story points
  • Work item 9: 5 story points

Why not work item 1, followed by work item 2 and work item 3? This is because of prioritization of bcklog work items, which you can also do with MS Project Agile.  

In the previous linked article with respect to working with User Stories, we have already created the Story Points custom field. We will build-upon that custom field. 

“Planned Velocity” Custom Field

The “Planned Velocity” custom field is not available by default in MS Project Agile. To have this custom field:

Go to the Task Sheet Tools > Format tab > Columns > Custom Fields command.  

The created custom field for Planned Velocity is shown below. As you can see, it’s just below the Story Points custom field that we have created earlier.  

As you create this custom field, do note the following:

  • It’s a number custom field, specially I’ve used Number 3.
  • The formula applied is simple. It directly equals “Story Points” custom field earlier or specifically Number 2.
  • Do note that roll-up has been applied for the calculation of summary tasks. And, when you use the roll-up, have the Sum function

“Actual Velocity” Custom Field

The “Actual Velocity” custom field is also not available by default in MS Project Agile. To have this custom field, again:

Go to the Task Sheet Tools > Format tab > Columns > Custom Fields command. 

Again, with the custom field command we will create this new “Actual Velocity” custom field. It’s quite simple and straightforward. This is shown below. 

As you create this custom field, do note the following:

  • It’s a number custom field, specially I’ve used Number 4.
  • The formula applied is simple. If the percent of complete (% Complete field) is 100%, then Actual Velocity will equal Planned Velocity, otherwise it won’t.
  • Again, do note that roll-up has been applied for the calculation of summary tasks. And, when you use the roll-up, have the Sum function

Backlog with User Stories, Planned Velocity and Actual Velocity

As we have added these custom fields, we can now visualize them in the Task Board Sheet view, Sprint Planning Sheet view or even the Gantt Chart view. You can choose any view you want. 

Considering the Sprint Planning Sheet view, which has information for all the Sprints, we will get the following view. While going for the view, I’ve applied the built-in Sprint grouping. Re-read the last line. It’s important! 


Obviously, as we have not tracked any item, the “Actual Velocity” for Sprint 1 is informed to be zero, whereas the Planned Velocity is 16.

Switching to the Gantt Chart and applying the Sprint group again, we have the following view. Do note that I’ve added a new column of % Complete. 


Interpreting the above figure, we can say:

  • Sprint 1 has three items estimated at 5, 8 and 3 story points, respectively.
  • When rolled-up the Planned Velocity is 16, which is basically the summation of all stories, i.e., 16 story points = 5 story points + 8 story points + 3 story points.
  • The Actual Velocity is 0, because we have not tracked any work items. In other words, the team has not started working on the items.

Track the Work Items – Current Sprint 

After you have planned for the current Sprint (Sprint 1 in our case), you can track the items in the Current Sprint Board view. For tracking, you have to just drag and drop the work items across the workflow states. 

Consider that we are on the final day of the current Sprint (Sprint 1) and we have made progress on a number of story items. This is shown below. 


Interpreting the above figure, we can say:

  • The work item of “As a user, I can log into the online systems…” has been completed, so also the work item of ‘As a user, I can buy a stock…”. These are 100% complete.
  • The work item of “As a user, I can create a new user…” is still under progress and it’s 50% complete. 

Visualize Actual Velocity – Current Sprint 

Now, you can switch back to the Gantt Chart view to see the Actual Velocity value being populated based on % Complete. This is shown in the below figure. 

Interpreting the above figure, we can say:

  • Sprint 1 has three items estimated at 5, 8 and 3 story points, respectively. Hence, the Planned Velocity is 16. We have seen this earlier. 
  • The Actual Velocity is 8, because we two work items estimated at 5 and 3 story points, respectively are now complete. Hence, the rolled-up value is 8.
  • One work item is 50% complete and it doesn’t count towards velocity, i.e., the work item of “As a user, I can create a new user…”. 

Conclusion

Is it really that simple to calculate velocity with MS Project Agile? Yes, it is!

As we saw in this article, with a minimal set of steps, you can calculate the velocity for any Sprint in a Scrum project. All you have to do is to have a couple of custom fields and use the available views and group to calculate the velocity for you.

If you want to see use the Current Sprint Sheet view, there too you can visualize the Planned Velocity and Actual Velocity.  


Another question that comes up: 

Can one plot a Velocity Histogram with these values? 

Yes, absolutely you can. As the fields are properly populated, you can quickly create a histogram with Report functionality of MS Project Agile. 


I hope this article helps you in planning your Sprint or Backlog plan with velocity and it helps in your work. If you have any comments or inputs, do put them below in the comment section.

References:

[1] Book: I Want To Be A PMI-ACP: The Plain and Simple Way, by Satya Narayan Dash

[2] Master Course: Mastering MS Project Agile, by Satya Narayan Dash

[3] Video Course: Microsoft Project Live Lessons, by Satya Narayan Dash.

Friday, February 10, 2023

Working with User Stories and Story Points in MS Project Agile (Scrum)


Want to master MS Project Agile? Learn in and out of it?

Course available at a very low cost: ðŸ‘‰ MASTERING MS PROJECT AGILE

The course comes with a full money-back guarantee!

The free article follows.

--

Recently, while interacting with many Agile practitioners in a webinar, a number of questions came-up on the capability of MS Project Agile software with respect to user stories and hence, associated tasks. MS Project has features, tasks and as you’d know the features can be broken down into tasks. However:

  • Can MS Project Agile have items in user story format?
  • Can the stories be estimated in story points?
  • Can the stories be broken down into tasks?

You can watch the international webinar here:

Practical Scrum using MS Project Agile (2 of 3) by MPUG

Yes, absolutely you can! In this article, we learn more such capabilities with MS Project Agile. To download and use the MS Project Agile, you can use the following step-by-step installation guide.

Step-by-Step Guide: Install, Set-up and Run MS Project Agile 

In-depth, hands-on explanation with User Stories and how to address them have been explained in the below video course:

Mastering MS Project Agile – Scrum, Kanban and ScrumBan

User Story Basics

A story is written on a stick note, a simple piece of small paper, a card or an electronic card, if you are using a sophisticated software tool. A user story has three aspects:

  • Who – Who wants this?
  • What – What is wanted to be done by this?
  • Why – Why does someone want it?

A user story is written in this format: 

As a <role>, I want <need>, so that <value or benefit>.

The first role part is about “who”, the second need part is about “what” and the third value or benefit part addresses “why”.

You can learn more on various types of stories in this article of Stories about Stories in Agile Development. 

“Story Points” Custom Field

The Story Points field is not available by default in MS Project. You have to create a custom number field for this purpose. To assess the custom field:

Go to the Task Sheet Tools > Format tab > Columns > Custom Fields command. 


 A number custom field has been used as story points are calculated in numbers. If you are not going with story points, you can have feature points or simply, points. This is shown below. 

Backlog with User Stories 

Let’s say currently in our Product Backlog, we have the following items. This is shown in the Sprint Planning Sheet view. (click to enlarge the view)

As you see in the above figure, while the higher ordered items towards the top of the backlog are written in user story format, and they are estimated in story points, whereas the lower ordered items towards the bottom of the backlog are not in user story format. They are also not detailed or estimated in story points. 

This is expected as we plan for two to three upcoming Sprints, while refining the product backlog. You’d have noticed the items written in Story formats are estimates as 3, 5, 8 story points. 

More Refined User Stories

Many Agile/Scrum practitioners break-down stories into tasks and I’ve also noted it in the earlier linked article of stories. This can be done quickly with MS Project software. 

For example, the below story (first one in the list):

  • As a user, I can log into the online system, so that I can access.

This can be broken down into multiple user stories, if you want to provide access in a number of ways. For example, it can be:

  • As a user, I can log into the online trading system with my Email account, so that I can access it via my Email ID.
  • As a user, I can log into the online trading system with my payment wallet, so that I can access it quickly.
  • As a user, I can log into the online trading system with my social media XYZ account, so that I can access it via social media XYZ.

In such a case, you just have to write them down in the text area of the Task Name field in the Sprint Planning Sheet view.

Backlog with User Stories and Tasks

Many Agile/Scrum practitioners take the user stories and break them down into tasks. This happens during the Sprint Planning meeting. As shown earlier, we have many stories for the upcoming Sprint or Sprint 1. It’s shown in the below Board view. (click to enlarge the view)

Now we are going to break them into individual tasks. I’m going to use a boiler-plate set of tasks for these stories and break-down each story into tasks. For example, consider this user story:

  • As a user, I can log into the online system, so that I can access.

One can break them down into individual tasks, such as:

  • Task – 1: Design and develop
  • Task – 2: Implement UI
  • Task – 3: Prepare test plans
  • Task – 4: Execute test plans
  • Task – 5: Integration work
  • Task – 6: PO Review

All these can be done in the Sprint Planning Sheet view or Gantt Chart view. Once you have created the tasks under the stories, it will come as shown below in the Gantt Chart view.  

This also can be seen in the Sprint Planning Sheet view or Current Sprint Sheet view with a grouping applied.  


As shown:

  • The story has been broken down into individual tasks.
  • The story name is shown as the Task Summary Name, which is correct.
  • Both the story and the related tasks are associated with the Sprint.

Video - User Stories and Story Points

You can watch the following video [duration - 5m:30s]. to see a demonstration how user stories are written, estimated in story points, broken down to tasks, tracked and managed using MS Project Agile software tool.


Conclusion

As we saw in this article, the MS Project (Agile) software has the needed functionality to write each (product) backlog item in the form of user story. A story can be broken down into a set of tasks, and each task can be estimated with duration, start and finish dates.

Next, you have to assign the resources to the tasks and start Sprinting for your project. As you Sprint, you have to just drag and drop the cards in the Current Sprint Board view to complete them. 

As you move the cards across the board, it’ll come as shown below. 

Is it that simple to write with user stories in MS Project Agile? Yes, it is! 

You can quickly write the stories, break them into individual tasks and track them to completion. 


References:

[1] Book: I Want To Be A PMI-ACP: The Plain and Simple Way, by Satya Narayan Dash

[2] Video Course: Mastering MS Project Agile, by Satya Narayan Dash

[3] Video Course: Microsoft Project Live Lessons, by Satya Narayan Dash.


Monday, March 21, 2022

The Big Picture with Story Map in Agile Development


“I keep six honest serving-men,

They taught me all I knew,

Their names are What and Why and When,

And How and Where and Who.

I send them over land and sea,

I send them east and west,

But after they have worked for me,

I give them all a rest.”

– From the poem, “The Elephant’s Child,” by Rudyard Kipling

Long ago, in my childhood days, I was introduced to the fascinating world of poetry by my father, who brought a variety of poems and stories from writers and authors around the world to me. “The Elephant’s Child” was one of them.

This poem in particular has been used as a method. That is, the Kipling method. One of communication management, risk identification, charter preparation, and also, product development. With this method, one gets various ideas considering multiple aspects: What, Why, When, Where, Who, and How. It’s also known as the 5W1H method. In this article, we will learn about a technique called Story Mapping, where this method can be employed as an initiation point.

With the 5W1H method, when starting product development or creating a service or solution, one asks questions such as the following:

  • What needs to be built?
  • Why are we building it?
  • For whom are we building?
  • When will it be needed?
  • Where does this fit in?
  • How are the customers going to use it?

Jeff Patton, the creator of the User Story Mapping technique, explains the building of the map in six simple steps. They are:

  • Frame the idea or problem
  • Map the big picture
  • Explore
  • Slice out a release strategy
  • Slice out a learning strategy
  • Slice out a development strategy

The above 5W1H questions address the initial steps. It is important to remember that these questions get the conversations rolling. Shared conversations and shared understanding can then occur, as those aspects are what stories are mainly about.

Story Map Definition

As you may have noticed, this article is about Story Mapping, not User Story Mapping. There can be varieties of stories: spike stories, analysis stories, risk stories, and architectural stories, among others. I’ve seen all such stories being part of the map, and hence, will be using the term, Story Map.

Let’s begin with the definition of a story map. I'll define it as follows:

Story map is a grid-like graphical representation of epics and stories in a sequenced order based on their business value and the order in which the stakeholders will execute them. When read from left-to-right of the map, it tells a big story in a sequence of steps, whereas when read from top-to-bottom, it gives more details about each step.

After you have framed the idea or problem with the 5W1H questions, you can begin to build a story map at a very high level with the help of above definition.

The customer, user, or subject matter expert may tell the story of the product being built in a sequence of steps. Each step is written on a sticky note, index card, or electronic card horizontally (from left to right). Then, under each step, the details are written on another set of cards, and this time, placed vertically from top to bottom. This forms a grid-like structure as shown below. This is a story map.

In his book, Jeff Patton calls the steps from left to right, “Activities”. Under each activity, you have a set of “tasks”, which you get when you break-down or decompose the activities.

As shown, the story is told by a user from left-to-right in a sequence of steps—each step being an activity. This sets the narrative flow. Under each activity, we have a set of tasks decomposed from the respective activity, and they are placed vertically from top-to-bottom.

With this basic understanding, let’s go a bit deeper and understand the various components of a Story Map.

Going forward, I’ll be using terms such as Epics (in place of Activities) and Stories (in place of Tasks), to maintain consistency with an earlier article on Agile development. In the real world, it doesn’t matter which terminologies you use, if you understand the concept and can apply it while building your product or solution. 

Building Blocks in a Story Map

Personas

The story telling for a story map starts with the persona. Persona is usually taken for a user, but in this case, I’ve extended it to stakeholders. The persona is an imaginary representation of the stakeholder role used while describing a story. You may express this element as the needs of an imaginary stakeholder. The persona can have likes, dislikes, a job, and goals, among other aspects. A persona plays a role in the organization—the role is real, but the persona is not.

The epics are considered from the persona’s perspective. For example, the story explains how the stakeholder is going to use the product or solution. Comparing a story map to a human being, you can say the persona will act as the head of the story map. The first thinking part starts here.

For story mapping, there can be many personas – not just one. This is similar to a human being who grows with input from many. When working with personas, a variety of stakeholders in various roles should be considered, who will interact with the product being built.

Backbone

Without a spine, a human can’t function, and similarly, without a backbone, a story map can’t function. The backbone provides the minimum set of capabilities needed to deliver the product or solution or service. This can also be called the minimum viable product (MVP). The backbone usually consists of features and epics.

Walking Skeleton

Just below the backbone, we have the map’s body part. The body consists of the walking skeleton. Again, making a comparison to the human body, you can say the walking skeleton is the story map’s skeleton, too. Just like the human body’s skeleton, without the walking skeleton, the product would be non-functional.

The walking skeleton is the complete set of end-to-end functionalities that make the product or solution acceptable. This part of the story map’s body usually consists of stories, including the user stories. This set of stories make the product minimally functional, and hence, can be called the minimum marketable features (MMF).

Under each story of the walking skeleton, you can have more stories arranged vertically. Higher priority stories will be at the top, whereas lower priority ones will be at the bottom.

When you combine the personas, the backbone, the walking skeleton, and the additional stories below the walking skeleton, you get the Story Map, as represented in the below figure.

The stakeholder starts telling the big story in a sequence of steps, which are represented as epics. This constitutes the backbone. While building the backbone, the principle of “mile wide, inch deep” or “kilometer wide, centimeter deep”, as Jeff beautifully puts it, is followed. It means we get to the end of the big story, before diving deep into the details.

The walking skeleton is below the backbone. When you decompose the epics in the backbone, you get the stories in the skeleton—ones that make the product minimally functional. Below the walking skeleton you have more stories, which are ordered.

Release Planning with a Story Map

After you have placed the epics, stories, and features in the story map based on the team’s capacity to deliver, releases can be determined. This is where the release strategy is sliced out from the story map.

As we already know, the backbone includes all the absolute essential parts of the product. These are items that you just can’t prioritize because they have to be in the product. Next to the backbone, we have the walking skeleton, which has the minimum marketable set of features. Hence, our first slice for the release consists of these two, and possibly some more stories, below. In the next slice (for another release), we can take more stories and create another release, and so on. This is shown in the figure. 

As you can see, in the first release we have the backbone and stories from the walking skeleton, along with one story below the backbone. In our second release, we have more stories taken, which are from below the backbone. Remember that these stories are ordered based on their business value.

Story Map vs Product Backlog

At this stage, you may be wondering why one should go for a Story Map rather than a Product Backlog?

After all, the product backlog also has all the epics, features, and stories in a single file. It can also have release slices. There are quite a few differences between the two, but I’ll note the most significant ones:

  • While working with the product backlog, it’s easy to get lost in the details. Team members will be working on tasks, but they don’t see the big picture. You can literally miss the forest for the trees! With a story map, all members of the team see the big picture. This, in my view, is the most significant benefit of a story map over a product backlog.
  • The story map is a two-dimensional visual structure, whereas the product backlog is a one-dimensional flat structure. Story mapping, on its own is also a prioritization technique—it’s just that it is done in a visual way.
  • Dependencies can’t be easily shown in a product backlog as long as it’s a flat one, whereas dependencies can be represented visually and more clearly with a story map.

So, which should one use?

Note: You can learn the various differences between Story Map and Product Backlog in the below detailed post.

Agile Asanas: Story Map Vs. Product Backlog - The Differences 

The primary idea behind telling stories is communication. As noted earlier, it’s about shared conversations and shared understanding. You may think of using both the story map and product backlog in a single map, which is shown in the below figure.


The product backlog is just below the story map with a set of index cards or sticky notes, which are the backlog items. When needed, you can pull the prioritized ones into the story map. Don’t just go by the lumped-up cards in the backlog. Remember, you can order them as well.

It’s up to you as the Product Manager or Product Owner in consultation with your Project Manager and team members to decide which one best works for the team.

At this stage, it’s pertinent to note that like a Product Backlog which is never complete, a Story Map is also never complete. When new feature requests come up or enhancement requests are made, you can add, arrange, and order them within the story map.

A Practical Story Map

Let’s look at a real-world example to understand story mapping further. I’ll use my previous example of a flight ticket reservation portal, where I had explained various types of stories.

We will first start with the possible stakeholders (personas) who will be using this portal:

  • Normal Traveler
  • Business traveler
  • Frequent Flier
  • Booking Agent
  • Vacation Traveler
  • … you can add more.

You need not work on all of them, but can take just one to build the MVP consisting of the backbone and walking skeleton. For our example, let’s take the “Business Traveler.”

Considering the business traveler, we need to determine the big story in a sequence of steps. These steps will form the backbone or set of epics. These epics, when broken down, will provide the stories, which are listed next to them.

The epics are noted in the below table. Can you think of the associated possible stories?

Go ahead and try it.

The associated stories for the epics are noted in the below table. Your answer may vary, but you’re right if you tried to break-down and get to the related stories.


The above stories can be put in the usual story format. For example, you can say: “As a business traveler, I want to register via e-mail, so that I can sign-up for the portal.”

I’ve also noted the epics in the above table in single words. Search for a flight is simplified to “SEARCH,” select a flight becomes “SELECT,” and so on. This is for simplicity and to keep our high-level goals focused. When we take these epics and put them as a sequence of steps for the business traveler, we will get the following figure.

As shown, the story of a business traveler using the portal listed horizontally in a sequence of steps. The traveler will first sign-up, then search for a flight, and then select the flight. The traveler will pay for the tickets, and finally, close-out his/her interaction with the portal. These steps form our backbone.

Next, we will take the first big activity or epic, “SIGN-UP,” and arrange the stories associated with it vertically, as shown below. If you created your own stories, go ahead and put them below the respective epics within the structure of the backbone. This results in the walking skeleton and more stories below it.

Next, we slice out the releases from the map.

  • For the backbone, we will have SIGN-UP, SEARCH, SELECT, PAY, and CLOSE.
  • For the walking skeleton, we will have “new user registration” and “log-in” from “Sign-up,” “search by journey start/end dates” from “Search,” “Choose by shortest flight duration” from “Select,” “pay via credit card” from “Pay,” and “logout” from “Close.”

Your first release slice may look differently depending on the epics and stories you have chosen to start with. If your team has the capacity, take more. If this is the case, when you slice out the first release, it will result as shown below.


For subsequent releases, you and your team can decide which other stories are to be taken up.

That’s it! If you have understood so far and are able to slice out your first few releases in the map, you have understood the concept of story mapping well. It’s a long-read. But, I believe, if you have read it, worked on it, and gone through it honestly, it’s time to take a rest, as the poem I opened with says.

If you have comments, new views, or suggestions, do share them below.

This article is dedicated to the memory of my father, the late Harendra Nath Dash, who passed away last year on June 11. I miss him every day and feel his absence. He first introduced me to the world of poetry, stories, and books, so this is a tribute to him and his teachings.

--

This article was first published by MPUG.com on 23rd June, 2020. 


References:

[1] User Story Mapping – Discover the Whole Story, Build the Right Product, by Jeff Patton with Peter Economy

[2] I Want To Be An ACP: The Plain and Simple Way To Be A PMI-ACP, 2nd Edition, by Satya Narayan Dash

[3] The PMI Guide to Business Analysis, by Project Management Institute (PMI)