Friday, December 20, 2019

Practical RMP: How to Create Risk Exposure Plans and Exposure Burnup, Burndown Charts


In risk management, you have many steps to follow from risk identification to risk monitoring. However, if you ask anyone who has done risk management in the real world, one of the key areas to manage will be the management of overall project risk exposure. The questions that one generally faces will be these:
  • Is the overall project risk exposure within acceptable limit?
  • If not, have you re-planned and developed further/other responses to reduce the risk exposure?
  • Have you implemented the risk responses in order to actually bring down the exposure?
  • Are you continuously monitoring the overall project risk exposure?

In this post, I’ll will outline four steps needed to build Risk Exposure Plans – both pre-and post-mitigated. In addition, we will see Exposure Burnup and Burndown charts. Charts being visual, give you quick information and also, is effective for stakeholder communication. 

These steps are taken from “Practical RMP with Primavera Risk Analysis” course. It’s taken from one of the practical of this course using a real-world project. I’ve also mentioned it to be one of the benefits of this course. 

Before proceeding with the steps, I assume that you have:
  1. Completed risk management planning, because risk thresholds will be set here. These risk thresholds, in turn, will determine the acceptable level of overall project risk exposure.
  2. Identified the risks, and have documented in them in Risk Register.
  3. Prioritized the individual project risks. 

Now, let’s will proceed with the steps to create the Risk Exposure Plan. 

Step – 1: Ensure Proper Settings 
First, we will start with the proper settings for the integrated Risk Management Plan created with the help of Oracle Primavera Risk Analysis (PRA) software tool. Note that going forward, all the steps will be conducted with the help of PRA tool.

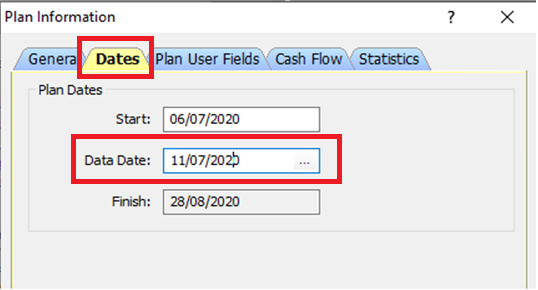
To create the risk exposure plan, first set the dates on which you want to measure the exposure. It can be either Start Date (of the plan) or Data Date (status date). This can be done by going to:

Plan – Plan Information 

This will open the Plan Information dialog box as shown below. Enter the Data Date. 


Step – 2: Determine the Pre-mitigated Risk Exposure 
In this step, we will determine the risk exposure based on the current scores of the individual risks. To do so, in the PRA tool, go to:

Risk – Risk Register –Tools –Build Exposure Plan...

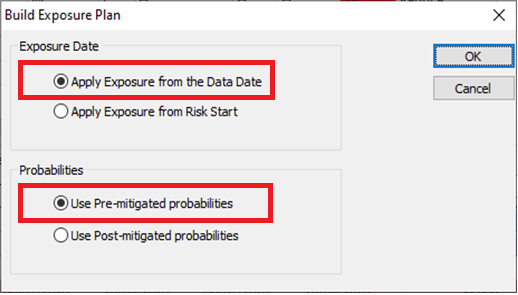
You can decide the form of exposure from Data Date or Risk Start Date with pre-mitigated or post mitigated probabilities. I’ve chosen the former. This is shown below. 


As shown above:
  • For Exposure Date, it will be “Apply Exposure from Data Date”.
  • For probabilities, it will be “Pre-mitigated probabilities”.

This is in line with our Step – 2, where we are determining the pre-mitigated risk exposure. Finally, click on OK button. 

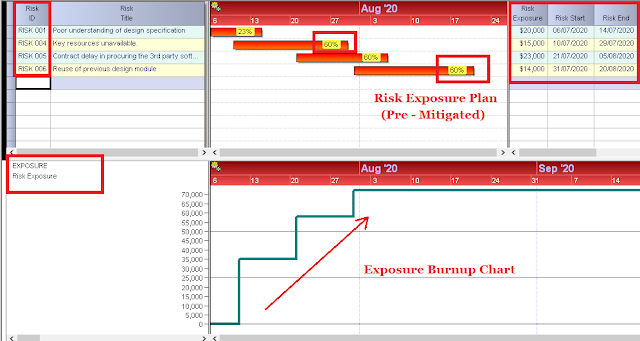
This will create the Pre-mitigated Risk Exposure Plan, which is shown below. It’s a view with two panels:
  • Upper panel – Pre-mitigated Risk Exposure Plan
  • Bottom panel – Burnup Chart


Let’s interpret the data in the above plan. First, let’s take the Pre-mitigated Risk Exposure Plan in the top panel.

We have 4 prioritized risks – Risk 001, Risk 004, Risk 005, and Risk 006. (Click on the above image for enlarged view)
  • For each risk the exposure % is noted in the bar chart, e.g., Risk 001 has 23% exposure. Risk 005 and Risk 006 have 60% exposure and so on. 
  • For each risk, the exposure cost is noted along with the risk start and finish dates. For example, for Risk 001 the cost is $20,000, for Risk 002 the cost is $15,000 and so on. 

Now, let’s interpret the Exposure Burnup Chart in the bottom panel.
  • The overall exposure as on Data Date is $72,000. This is the sum of all risk exposure, i.e., combing the exposure of all prioritized risks – Risk 001 to Risk 006.
  • Obviously, the exposure has gone up over time. For example, on July 10, 2020, it’s around $35,000 whereas on July 31, 2020 it’s over $70,000. The timeline on X-axis, whereas the exposure value is on the Y-axis.
  • This results in a Burnup chart, which is shown above.

Step – 3: Plan and Implement Risk Responses and Risk Response Action 
Let’s say that the overall exposure is high (we have determined earlier during risk management planning) and we need to bring it down. Hence, we plan for Risk Responses and associate the Risk Response Actions. These will be updated in the Risk Register (and in turn also in the Risk Report, if you go by the PMBOK 6th edition). The data for the below risk register is again taken from one of the practical of this course.

Step – 4: Determine the Post-mitigated Risk Exposure 
After you have taken the risk response actions, the exposure will come down for the risks. Next, again in the PRA tool, go to:

Risk – Risk Register –Tools –Build Exposure Plan...

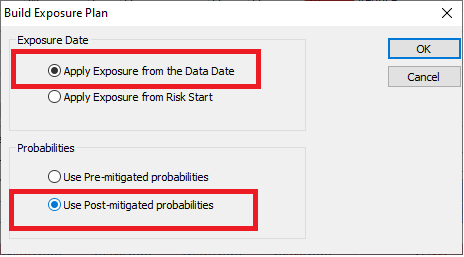
And build the plan for post mitigated probabilities. This is shown below. 


This will create the Post-mitigated Risk Exposure Plan, which is shown below. Again, it’s a view with two panels:
  • Upper panel – Post-mitigated Risk Exposure Plan
  • Bottom panel – Burndown Chart


Let’s interpret the data in the above plan. First, let’s take the Post-mitigated Risk Exposure Plan. (Click on the above image for enlarged view)
  • We again have the same 4 prioritized risks – Risk 001, Risk 004, Risk 005, and Risk 006.
  • For each risk the exposure % is noted in the bar chart. But now they are reduced, e.g., Risk 001 has now reduced to 8% (earlier 23%) exposure, whereas Risk 006 has 0% (earlier 60%) exposure, and so on. 
  • For each risk, the reduced exposure cost is noted along with the risk start and finish dates. For example, for Risk 001, it’s $5,000.

Now, let’s interpret the Exposure Burndown Chart in the bottom panel.
  • The overall exposure as on Data Date (11th July, 2020 which is set earlier) is $12,000. This is the sum of all individual project risk exposures. 
  • The overall project risk exposure has to go down over time. For example, on July 10, 2020, it’s around $12,000 whereas on July 31, 2020 it’s just $1,000. Again, the timeline on X-axis, whereas the exposure value is on the Y-axis.
  • This results in a Burndown chart. 

Step – 5: Monitor the Risk Exposures 
This is the final step and you continue to monitor the risks. If the probability and/or impact values of the risks change, then it will change the exposure values as well.

I hope with this you learn how to create the risk exposure plans and the related burnup and burndown charts. Of course, based on it you can create the needed reports and communicate with your stakeholders.


Thursday, December 12, 2019

MS Project 2019 Agile: Boards, Views, Tables, Groups and Filters - 2


In the earlier part of this serieswe saw various views and boards used in MS Project 2019 Agile. 

The content of this article are taken from the following courses. They are elaborated with a number of examples, real-world projects and tips:

As noted in the previous post, views are associated with tables, groups and filters. In this post, let’s explore some of these tables, groups and filters, which are frequently used. We will see the following tables.
  • Sprint Planning Table (Scrum)
  • Backlog Table (Kanban)
  • Task Board Tasks Table (Scrum or Kanban)
There are many groups. However, from Agile perspective, we will take two.
  • Sprint Group (Scrum)
  • Backlog Status Group (Scrum or Kanban)
And finally, we will see a few filters, which are frequently used.
  • Sprint Planning Filter (Scrum)
  • Backlog Filter (Kanban)
  • Task Board Tasks Filter (Scrum or Kanban)


II. Tables for Agile Features
A table in MS Project will have many columns and it will be shown with various rows to be filled-up with data. The columns are taken from the table’s definition, which is can be seen by going to:
View tab – Data group – Tables – More Tables…


There are many tables for Agile features. A view or a board is generally associated with a table. The tables definition can be seen from the selected table from there by going to:
View tab – Data group – Tables – More Tables – Edit… 

Sprint Planning Table (Scrum)
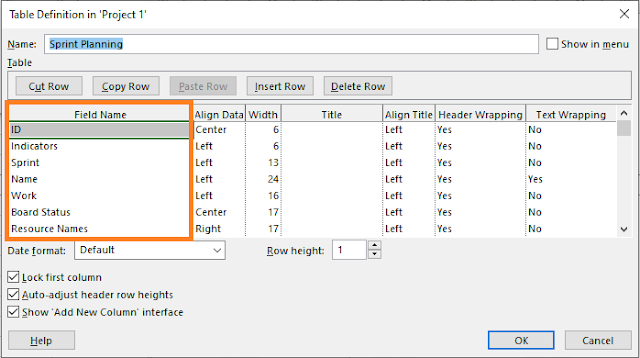
The Sprint Planning table is associated with the Sprint Planning Sheet view, as we have seen earlier. As shown below, in this table’s definition, we have a number of columns in the table such as Sprint (Sprint name), Name (task name), Work, Board Status, Show on Board etc.


Backlog Table (Kanban)
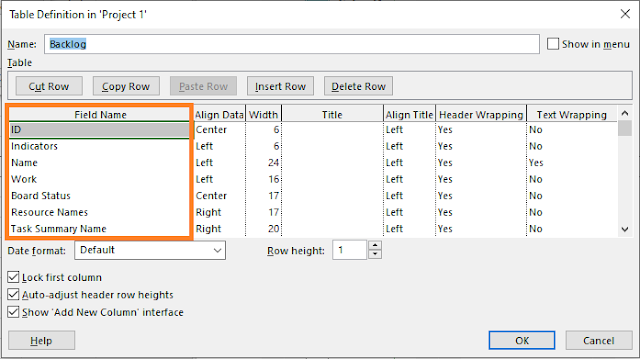
The Backlog table is associated with the Backlog Sheet view. It has a number of columns in the table such as Name (task name), Work, Deadline, Board Status etc.


Task Board Tasks Table (Scrum or Kanban)
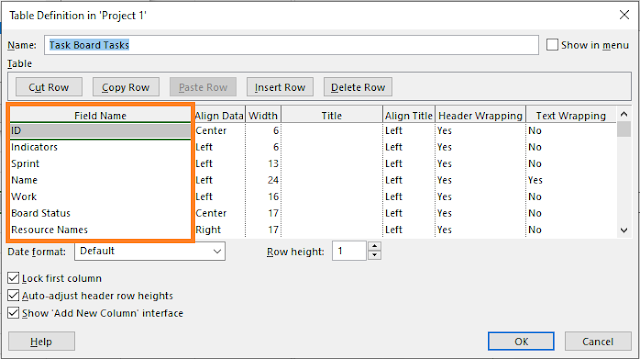
The Task Board Tasks table is associated with the Task Board Sheet view. It has a number of columns in the table such as Sprint (Sprint name), Name (task name), Work, Board Status, Show on Board etc.


Note: As you would have seen, the board doesn’t have any table associated, because the board is a graphical representation of cards.

III. Groups for Agile Features
In the above views and tables, as you would have noticed, we don’t have any groups associated. However, there are two in-built groups, which are quite useful.

Sprint Group (Scrum)
This group is specifically for Sprints project. By default, it’s not associated with any Agile related board or view. 


This grouping is simply by the name of the Sprint and it’s a task type field. This is shown below. Do note that there is another field called Sprint ID, which is very different from the field name of the Sprint.


Backlog Status Group (Scrum or Kanban)
This group can be for Scrum or Kanban project. It can be applied to Backlog Sheet view or Task Board sheet view. By default, it’s not associated with any Agile related board or view. 

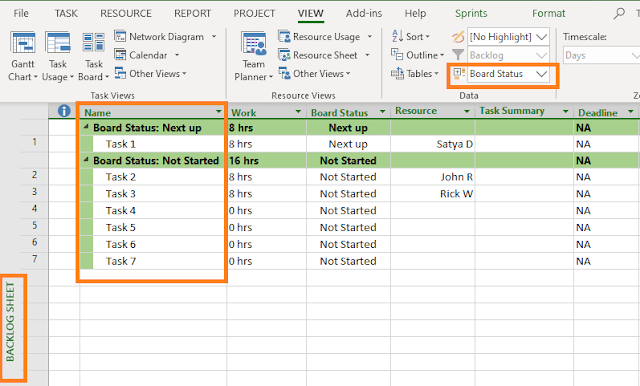
As shown below, I’ve applied it for Backlog Sheet view.


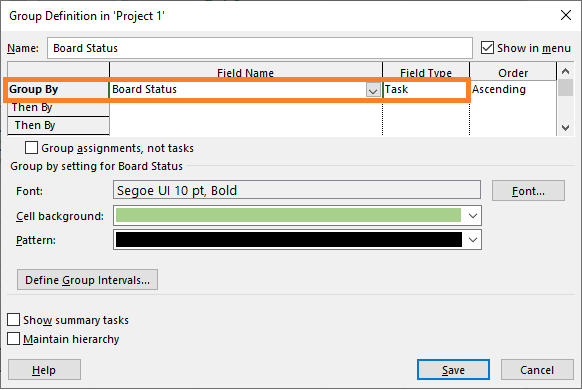
This grouping is simply by the status of the board and it’s also a task type field. This is shown below.


IV. Filters for Agile Features
You would have noticed that in the above views and tables, we have many filters associated. We will check some of these filters, which are frequently used.

Sprint Planning Filter (Scrum)
This filter is specifically for Scrum project. It’s applied to both Sprint Planning Board and Sprint Planning Sheet views. As you can see, the name matches with the name of the table, i.e., Sprint Planning Table, which we have seen before. The filtering criteria are shown below.


Backlog Filter (Kanban)
This filter is specifically for Kanban project. It’s applied to both Backlog Board and Backlog Sheet views. As you can see, the name matches with the name of the table, i.e., Backlog Table, which we have seen before. The filtering criteria are shown below, which are exactly similar to the Sprint Planning filter.


Task Board Tasks Filter (Scrum)
This filter can be for either Scrum or Kanban project. It’s applied to Task Board Sheet view, which we have seen before. The filtering criteria are shown below.


There are many other views available in MS Project 2019 Agile such as Current Sprint Planning Board, Current Sprint Planning Sheet, so also tables, groups and filters. Examples of other filters that you can use include Current Sprint Planning, Select Sprint etc. 

This series: Part - 1 ]

I hope these two posts, gave you the understanding needed to work with Scrum/Sprint and Kanban projects with MS Project Agile features.


Videos Courses on MS Project Agile and Hybrid-Agile:

Videos Courses on MS Project:

Monday, December 09, 2019

MS Project 2019 Agile: Boards, Views, Tables, Groups and Filters - 1


Microsoft Project Agile supports both Scrum and Kanban and it continues to the latest release of the software – MS Project 2019. To understand and work with the Agile features, you need to have clarity on:
  • Boards 
  • Views
  • Tables
  • Groups
  • Filters
The concepts of Views, Tables, Groups, Filters are foundational in MS Project. Every view in MS Project is based on a screen, table, group and filter. While working with the Agile features, you need to know these concepts and hence the post.

The content of this article are taken from the following courses. They are elaborated with a number of examples, real-world projects and tips:
In this series with two parts, I’ll be taking a few of these boards, views, tables, groups and filters. In part – 1 of this series, we will see some commonly used boards and views in MS Project 2019. We will see the following views/boards.
  • Sprint Planning Board View (Scrum)
  • Sprint Planning Sheet View (Scrum)
  • Backlog Board View (Kanban)
  • Backlog Sheet View (Kanban)
  • Task Board View (Scrum or Kanban)
  • Task Board Sheet View (Scrum or Kanban)

This series: Part - 2 ]

I. Boards and Views for Agile Features

A board in MS Project 2019 is basically a view with cards. A card is a graphical representation of a task with its attributes. There are many views represented as boards in MS Project 2019 Agile.

There are a number of views (including board views) for Agile features, i.e., to work with Scrum (Sprints) and Kanban type projects. We will see six of these. As I noted before, for each of this view, there will be associated Screen, Table, Group, and Filter. Hence, we will discuss them as well for the views/boards.

Also, do note that the usage of these boards/views will vary based on Agile framework chosen. For example, the Sprint Planning Board view is used for Scrum/Sprints project. Hence, next to the name of the view (or board), I’ve noted the Agile framework to be used.

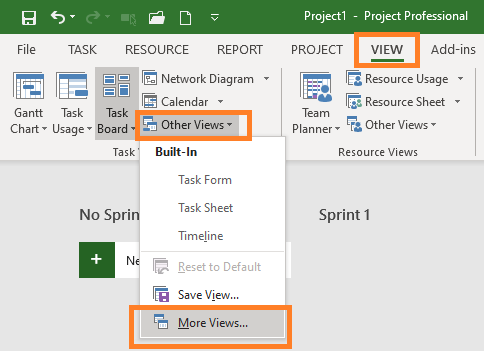
Now, one can see all the views in MS Project 2019 by going to:

View tab – Task/Resource Views group – Other Views  More Views...


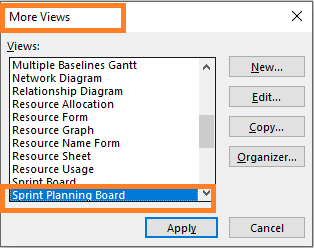
From there, you can select the view to see and then apply to the project.

As shown above, from the list of views, I've selected Sprint Planning Board view.

Sprint Planning Board View (Scrum)
The Sprint Planning Board view lists out the Sprints for a project in a graphical manner. The default number of Sprints shown are three. There is also a No Sprints column which is basically for the Backlog items. You can add as many Sprints you need.

For this view:
  • Screen used: Task Board
  • Table used: None
  • Group used: None
  • Filter used: Sprint Planning
This can be seen by checking the definition of the view, from:
View tab – Task/Resource Views group – More Views – {View Name} – Edit …

For Sprint Planning Board view, we have the below details.


As you can see, the screen associated is Task Board, whereas the filter associated is Sprint Planning.

Sprint Planning Sheet View (Scrum)
The Sprint Planning Sheet view lists out the Sprints for a project in a tabular manner. The default number of Sprints shown are three. You can add as many Sprints you need.

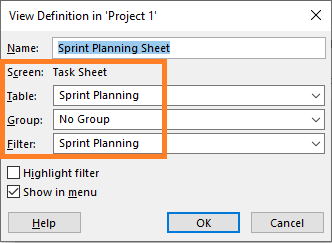
For this view:
  • Screen used: Task Sheet
  • Table used: Sprint Planning
  • Group used: None
  • Filter used: Sprint Planning


Backlog Board View (Kanban)
The Backlog Board view lists out the items for a project in a graphical manner. The default number of workflow states or columns shown are four – “Not Started”, “Next Up”, “In Progress”, and “Done”. The “Not Started” column is basically for the backlog items, which are not yet to pulled into any workflow state. You can add as many columns as you need.

There is no concept of Sprints in Kanban and hence this view does not show any Sprints.


For this view:
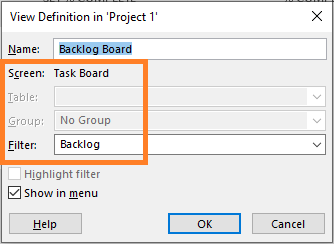
  • Screen used: Task Board
  • Table used: None
  • Group used: None
  • Filter used: Backlog


Backlog Sheet View (Kanban)
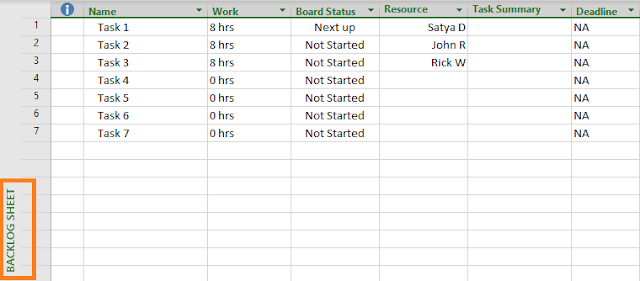
The Backlog Board view lists out the items for a project in a tabular manner. Again, note that there is no concept of Sprints in Kanban and hence this view also does not show any Sprints.

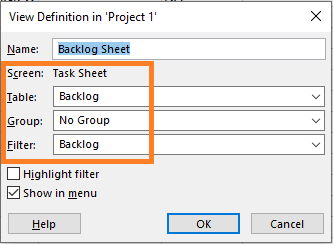
For this view:
  • Screen used: Task Sheet
  • Table used: Backlog
  • Group used: None
  • Filter used: Backlog


Task Board View (Scrum or Kanban)
This is very similar to the Backlog Board view we saw earlier. It has also four default work flow states – Not Started, Next Up, In Progress, and Done. You can add new workflow states, too.

For this view:
  • Screen used: Task Board
  • Table used: None
  • Group used: None
  • Filter used: None

Task Board Sheet View (Scrum or Kanban)
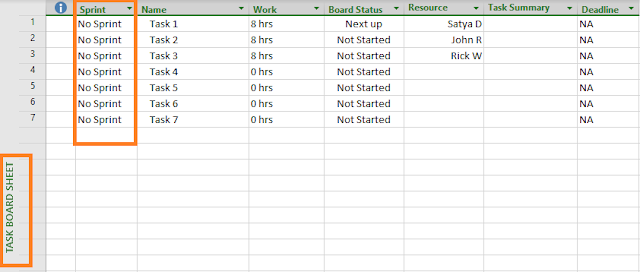
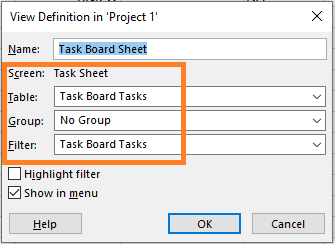
This is very similar to the Backlog Sheet view we saw earlier. However, here you have a column for Sprints! Hence, you can use it for both Kanban and Scrum. If you are using Kanban, then obviously, you will have “No Sprints” status in the “Sprints” column. If you are using Sprints, then the respective Sprint names will be shown.

For this view:
  • Screen used: Task Sheet
  • Table used: Task Board Tasks
  • Group used: None
  • Filter used: Task Board Tasks


In the next part, we have discussed the tables, groups and filters used in MS Project 2019 Agile.

This series: Part - 2 ]


Videos Courses on MS Project Agile and Hybrid-Agile:

Videos Courses on MS Project:

Friday, December 06, 2019

Microsoft Project 2019 Agile: Working with Sprints Project - 2


In the first part of this series, we learned how to use the Agile features with right builds and client edition of MS Project 2019 software. We also explored basic functionalities while working with Sprints project. In this post, we will discuss the following.
  • Renaming a Sprint
  • Changing the Duration of Sprint(s)
  • Populating Tasks in Sprints
  • Sprint Planning Views
  • Navigating across Sprints
  • Customizing Sprint Board Cards

Again, do note that to work with Agile features, you must have the right release(s). Agile features work only with MS Project Online Desktop Client. We have seen it in earlier part of this series.

This series: Part - 1 ]


6. Renaming a Sprint
The renaming of Sprint can be done with Manage Sprints window, too. Select the Sprint you want to rename and give the name you want to have. Let’s say we want to rename the Sprint 5 as Hardening Sprint. This is shown below.


Next, click on the OK button in the Manage Sprints window/screen. Your renamed Sprint will be shown in the Sprint Planning Board view. The updated board is shown below.

7. Changing the Duration of Sprint(s)
You can change the length of a Sprint by selecting the Length field in the Sprint List of Manage Sprints window. Otherwise, while adding a Sprint, you can use the Duration field in the bottom-half the same window. 


As shown above, I’ve changed the duration of Hardening Sprint (Sprint 5) from 2 weeks to 1 week.
8. Populating Tasks in Sprints
To add tasks into a Sprint, click on “+” sign under No Sprints column and enter the name of the task. The No Sprints column is actually the Product Backlog, which will contain all the items that you want to deliver in the Sprints. To delete a task, again click on the cross mark.


In our case, I’ve added 7 tasks and it comes as shown below. These are all listed under No Sprint column.

Next, you have to simply drag and drop the tasks into the respect Sprints you need. For our case, as shown below, I’ve moved the tasks across 4 Sprints. 


To remove any task from a Sprint, you can simply drag it back to the No Sprint column. If you want to remove the task completely, then simply right click on the task and use Delete Task option. This is shown in the below.

9. Sprint Planning Views
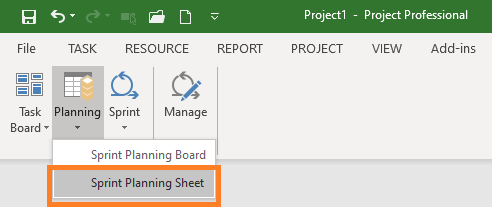
The default view for Sprints project is the Sprint Planning Board view. In case you want to see the entire backlog in a tabular format, just switch to Sprint Planning Sheet view. To do so, go to:

Sprint tools – Sprints – Views – Planning – Sprint Planning Sheet.

This is shown below.


Next, the Sprint Planning Sheet view will be shown with the following details.


The Sprint Planning Sheet view has the information for all the sprints, except the Hardening Sprint. This is because we don’t have any task (yet) as part of this Sprint.

10. Navigating across Sprints
To navigate across Sprints, go to: 

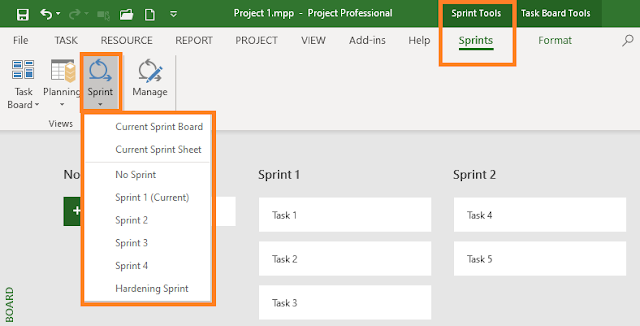
Sprint Tools  – Sprints – Views – Sprint.

Next select the drop-down menu. All the Sprints, including Current Sprint will be shown. For the Current Sprint, you will have both the board and sheet views. This is shown below. 


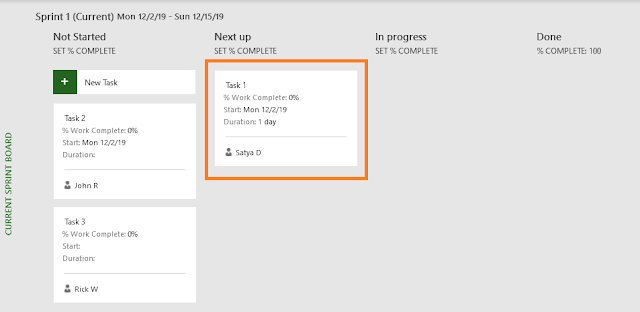
Next, I selected the current Sprint Board. Then, the view will come as shown below.


As shown above, the view used by MS Project 2019 is Current Sprint Board and it lists out the tasks to be executed in the current Sprint. The dates for the current Sprint are also noted on top. You can drag and drop the tasks across the columns when you start working on them. 

11. Customizing Cards on the Sprint Board
To customize card on Sprint Boards (planning board or current sprint board or any other Sprint board), go to:

Task Board Tools – Format – Customize – Customize Cards.

This is shown in the below figure.


Next, click on Customize Cards icon and the Customize Task Board Cards window will show up. You can add up-to 5 fields to show on the cards, other than the base fields of Task ID, Resources, 100% completion checkmark. 


As shown above, I’ve added three fields - % Work Complete, Start and Duration. Next, the Current Sprint Board with the customized cards are shown below. I’ve added a few resources to card by right clicking on the cards and using Assign Resources command. The filled up detailed in the cards will now come as shown below.


********

As noted in the Part – 1 of this series, a number of features have been added for MS Project Agile features. I find the new features to be very helpful and useful. And I believe it will add a lot of value to project managers and project leaders working with MS Project software.

I have used this software for long and like the software for its high usability and simplicity. The new features, enhancements and fixes show that Microsoft Project Team is continuously working on this software and bringing more value for the users.

Great work again MS Project Team! 


Videos Courses on MS Project: