I decided to purchase this course after a lot of extensive research for a specific purpose after being tasked with building and managing a programme plan with Agile methodologies. I could not find any examples, templates, or learning anywhere and I was absolutely delighted when I came across ManagementYogi’s Mastering MS Project Agile course.
My task was to create an MS project plan template for my team which shows all aspects of agile and traditional waterfall and then from that provide a rolled-up view of a programme plan. When I contacted Satya, he advised me to start with this course. I am so pleased I made the decision to take this course, it has met over and above my basic requirements.
Unique Selling Point (USP)
This entire course is so unique. It starts from the beginner steps right the way through to where you become comfortable with how MS Project agile tools actually works and gets you into advanced concepts practically and theoretically.
The course covers in detail all the different boards and views available, how to get in and out, how to input the data, how to remove data, where it appears, how to sort the tasks, how to move them, how to create the custom views, all the reporting views, the terminology, there are many, many aspects to it.
Basically, the course takes from a beginner level to an advanced level and to the level of an expert.
What I Learned and How It Helped?
I’ll highlight the following things that I learned so far from the course:
I really now understand what agile projects are and what my team is working on. Nothing is missed out which means you really get to know the MS Project agile tool inside out.
I got a good grip on the various board and sheet related views of Scrum and Kanban, which view is used for what and how to get to them, various Agile/Sprint/Kanban fields and associated functionalities.
I learned how to build burn-down charts, burn-up charts. I learned how to create charts and how to make them presentable using all the extra tools and tips. It is very detailed which means you can very quickly become proficient and an expert in this.
It is definitely practically-led, nothing is left out. In my opinion, if someone is learning this for the first time or even if they know how to use the MS project software with Agile functionalities, it is still worth doing.
It has really empowered me. I can confidently speak about how the Agile plan(s) should be put together. I know when project managers themselves are not understanding how to plan their own deliverables with MS Project (Agile). I can definitely help guide them and apply best practice and industry standards after doing this course.
Providing all the exercise files were so helpful for me. You can easily follow along with the video and see how it should look in the actual file. And then can create your own files. This course’s solution files will give you the foundations to build your learning.
Agile in a hands-on manner with MS Project is a niche skill. I am in a Planning Manager role and MS Project Agile is a highly sought-after skill. This course definitely fast-tracked my skill set. It will make you stand out in whatever project management field you are in.
The explanations are simple, clear and understandable and one can grasp all the technical terms as well. The videos are well presented, everything is organised, neatly structured. You get all the materials, a course structure guide, which helps to know where you are and how many lessons and videos you have left. I really absorb Satya’s teaching style and format.
I received helpful answers to my queries when I had questions and I continue to get support for my learning. ManagementYogi’s work is such a useful resource for me and he has got me out of what was thought as an impossible task and I have definitely impressed upon my team.
I’m revisiting all I learned. Now I am finishing the last part of the course, i.e., Advanced Scrum and Advanced Kanban.
It is such a great investment in many aspects, in terms of your own time, your own learning, your own career path, nothing is rushed, you can pace yourself, and you can go over things. If you don’t get it in the first few videos, you soon start to pick it up as the steps and learning are repeated.
I really appreciate the full value and I am very much grateful to management yogi for sharing his expertise, knowledge and experience and for going into so much depth and making the user comfortably know what they are doing.
Recommendations
I am surprised at the very low cost for the high quality and amount of training one receives. You basically get more out of it than you would expect. In my opinion it seems too good to be true, but it is true. It covers the entire length and breadth of MS Project Agile.
Whilst you are learning you get all these extra tips, when something can’t be done in MS Project Agile, the bonus is that there is a way and there is always a work around and this course gives you that as well.
You are likely to come across in real life work and at least then you have a way to fix things and you are not left stranded. So, everything is covered in this course and again I am grateful to Satya for covering this in the course. Thank you so much ManagementYogi.
Wherever you are in your professional journey, I thoroughly recommend this course and would encourage you to just go for it. You have nothing to lose and everything to gain.
Brief Profile:
Ravi O’Reilly: Planning Manager Role, Working in UK Government and Transport related programmes and projects and application of industry best practice planning standards.
A project, unlike an operation, is a temporary endeavor. Because of this fact, every project will have a beginning and an end. There can be multiple projects launched within a program life cycle or a product life cycle. It’s also possible that a project can be specifically chartered within a portfolio, or a greenfield project can be launched independently by an organization. Regardless, a project always will have a definitive end.
The role of a project manager (PM) is not only to plan, execute, and track a project, but that of closing a project properly. I see many PMs use the MS Project software tool to work on a project over its life cycle, but most don’t use MS Project to close the project.
MS Project actually provides a number of functionalities with which a PM can close a project. There are inherent and intrinsic good reasons for closing a project, such as:
Informs the stakeholders that the project is closed,
Releases the project resources to be used for other organizational initiatives,
Helps the current project team on the final performance of the project,
Archives documentation that can help as Lessons Learned for other PMs in the organization and for future projects,
Allows the template from the closed project to be (re)used in other projects.
Let’s explore the various activities involved in closing a project using MS Project.
Conduct a Variance Analysis
This is usually the first thing a PM should do. The results of the variance analysis are included in the Final Report of the project. Variance and Variance Analysis are two separate, but intertwined terms.
Variance is the quantifiable difference from the baseline or a known boundary.
Variance analysis, on the other hand, is a technique with which one can know the cause and degree of difference between latest baseline and actual performance.
With variance analysis, you can know which activities or work packages in the project performed according to the plan and which occurred off the plan. The MS Project software comes with a number of baselines, which can be seen by going to Project tab > Schedule group, and executing the Set Baseline… command.
Let’s check a few fields in the above table to see how they are in-built into the MS Project software. The default Entry table of MS Project doesn’t show various variance fields, although you can add those fields/columns into the table and get the displayed view.
To see the start and finish variances, switch to Variance table by going to View tab > Data group > Tables drop-down menu.
By switching to this table, you will see the populated fields for Start and Finish Variances for the activities, work packages, and the entire project.
As shown in the above figure:
For the work package Requirements and Analysis, Start Variance = 0 days and Finish Variance = 7 days.
For the activity PRD Preparation, under the above work package, Start Variance = 2 days and Finish Variance = 5 days.
For the activity PRD Approval, again under the above work package, Start Variance = 6 days and Finish Variance = 7 days.
Similarly, you can see the work variance by switching to the Work table and the cost variance by switching to Cost table.
Inactivate the Unnecessary Tasks
It’s possible that during a project life cycle, some planned activities are never executed. For example, it may be that some planned meetings didn’t materialize, planned tasks were never started, or your team didn’t execute a set of risk mitigation tasks because the risk(s) didn’t occur.
If you kept some of these tasks instead of deleting them because of an alternate plan of action, changing scope, or stakeholders modifying their needs and expectations, you are left with a number of unnecessary tasks. These should be inactivated as you close the project. For this purpose, you can apply the Unstarted Tasks built-in filter by going to View tab > Data group > Filter drop-down menu. Choose the More Filters… option and click the Apply button.
With the Unstarted Tasks filter applied, the tasks, which are not at all started, will be visible in your project view.
You can select these filtered tasks to be inactivated by executing the Inactivate command under Task view > Schedule tab. You can also inactivate by right-clicking on the task or on multiple tasks, and selecting the Inactivate Task command from the popped-up menu.
As shown above, two tasks, “Build script files for automation” and “Migration and backup,” have been inactivated.
Set the Remaining Duration to Zero
When you close a project, it’s also best practice to set the remaining duration of the incomplete tasks to zero.
In this case, we will do this by utilizing the Incomplete Tasks built-in filter, which can be selected by going to View tab > Data group > Filter drop-down menu. You can also select this filter from the More Filters… option, as we have seen earlier.
To set the remaining duration to zero for the tasks, you can use the Tracking table view. Access by going to View tab > Data group > Table drop-down menu. This is depicted in the below figure. Do note that in Tracking table, the Incomplete Tasks filter has been applied and highlighted.
Now for the two tasks, UAT Testing Cycle – 1 and UAT Testing Cycle – 2, highlighted in the above figure, we have a certain amount of remaining duration (noted in the Rem. Dur. field). You can manually edit the remaining duration to 0 days. After you make the changes, the updated view will be as shown below.
Let’s interpret the changes we’ve made:
As you edit the remaining duration to 0 days, the % Complete field (noted as % Comp.) becomes 100%. Earlier it was 50% for the concerned tasks.
The cumulative percentage complete for the summary task, Product Testing Cycle, goes from 86% to 95%.
There is no impact on actual cost and actual field. However, the % Work Complete field will be changed to 100%.
At this stage, it should be pointed out that the Incomplete Task filter used for this case is different from the Unstarted Task filter used earlier while inactivating the tasks.
Incomplete Task filter: For this filter, the % Complete OR the % Work Complete field values do not equal 100%.
Unstarted Task filter: For this filter, there is no Actual Start value for the task concerned. In other word, it equals NA (Not Applicable).
Set the Milestones to 100% Complete
When closing a project, you should also set the milestones to 100% complete. If a number of milestones in a project are incomplete, it’s difficult to say that the project is done and also difficult to get approval of project completion from the stakeholders and/or sponsor(s).
To view the milestones in a project, apply the Milestones filter by going to View tab > Data group > Filter drop-down menu. Next, set the % Complete field to 100% complete in the Tracking table, or by switching to the Entry table. In the below figure, I’ve switched to the Entry table and have applied the filter.
Now, the selected milestone can be set to 100% complete by executing the 100% Complete command under Task view > Schedule group.
In the above figure, the milestone has been set to 100% complete with the indicator column displaying a blue tick mark.
Create and Save a Project Template *** UPDATED ***
Some project management practitioners save their current project as a template, so that they can use the work breakdown structure future projects and/or can put such into the organization’s learning repository.
To do so, go the File tab, which takes you to the backstage view of MS Project. From there, select Export > Save Project as File > Project Template and finally Save As.
When you click on Save As command shown above, a dialog box will pop-up with the file name. Save as a Project Template in .mpt format.
In the above figure, the file name shown is “Closing Project.mpt” and the type is Microsoft Project Template (or .MPT format). When you hit the Save button above, another dialog box pops up.
In the above Save As Template dialog box, you can choose to discard the data that you don’t want to be part of the template and click on the Save button to save the template.
Communicate the Performance *** NEW ***
MS Project comes with a number of built-in reports which help to inform on the performance of a project and allow for easy communication with stakeholders during project closure. For example, considering schedule performance, it may be a good idea to utilize the following:
The Tracking Gantt view of the project, exported to a pdf format, to show the variances visually for the tasks
Earned Value related schedule performance measures such as Schedule Variance (SV) and Schedule Performance Index (SPI) (generate through Earned Value Report functionality)
For cost performance, you can use:
Cost Overruns report, which shows Task Cost Variance and Resource Cost Variance with cost overrun and/or underrun graphically
Earned Value related cost performance measures such as Cost Variance (CV) and Cost Performance Index (CPI), among others.
Cash Flow report, which shows the project’s cumulative cost and the cost per quarter
Conclusion
When closing a project, a project manager must perform and/or participate in a number of activities such as closing contracts with the vendors, finalizing any open claims, confirming that the deliverables are the latest and have been formally accepted by the customers, releasing resources, etc.
This article primarily focusses on what a PM should do to close within the MS Project tool. It’s possible that a project can be terminated even before completion if it’s not in alignment with the business needs. In such a case, a PM must close the project formally and can use the above procedures to do so with MS Project.
The Microsoft Project software tool comes with a number of view options, which, at a high level, can be thought of as Task Views and Resource Views. While views such as Gantt Chart, Team Planner, Resource or Task Sheet, Resource or Task Form, Resource or Task Usage are well used by project managers, many management practitioners often overlook the Resource Graph view or use it less frequently.
As I have ongoing opportunities to interact with MS Project practitioners, I’ve realized that this view is not all that well understood. As a result, its usage is limited; however, in practice, this can be a very useful view if one can learn a little about it. In this article, we will discuss various ways to launch it, formatting options, a plethora of data representations, and other usages of this view.
Let’s begin with the launching options of Resource Graph view.
Launching the Resource Graph *** UPDATED ***
The Resource Graph view can be launched in many ways.
You can go to the Views tab à Resource Views group à Other Views, and, from there, choose Resource Graph view.
You can also launch this view by going to the Views tab > Split group, and enabling the Details checkbox. Then, from the available dropdown menu, select Resource Graph for the Details Pane.
A third way to launch the Resource Graph view is by going to the Assign Resources dialog box, and clicking on the Graph button.
The Assign Resources dialog box can be opened by going to Resource Tab > Assignments group and using the Assign Resources command. Do note that for the Graph button to be activated, some work resources should be available in the project!
One can also launch the Resource Graph view from the View Bar of MS Project software. It's shown below.
Formatting the Resource Graph
The Resource Graph view primarily pulls data and values from task assignments. In other words, you need to have both tasks and resources assigned for such to populate the Resource Graph view.
By default, when you launch the Resource Graph, the below comes up as shown.
As you can see in the screenshot, we have just one resource (Resource 1) assigned to one task (Task 1).
With the launch of this view, the Resource Graph Tools menu has been activated, as well as the Format tab enabled. In fact, this tab, has three groupings of tools: Format, Navigate, and Data. Do note that the graph, by default, uses Peak Units for graphical data representation. There can be others, as well, which we will see shortly.
An important functionality available under the Format grouping is the Bar Styles command, which you can use to unleash the power of this view. Bar styles can be opened by going to the Format tab > Format group, and clicking on Bar Styles.
Bar styles shown clearly indicate blue colored bars for the allocation and deep red colored bars for overallocation. Bar styles are important, so that you can visualize and interpret various possible usages of the Resource Graph.
Let’s interpret the dialog box shown above:
It’s divided into three parts or sections – top, middle, and bottom. The top part has styles for overallocation, the middle styles for allocation, and the bottom styles for proposed booking.
The left side of this dialog box refers to the group data or the selected/filtered group of resources, whereas the right side defines one selected resource.
In the bottom section, we also have three options to show value, show availability line, and define the desired bar overlap.
Do note that the bar style is contextually sensitive, and depending on the data selected under Data Group > Graph: …, some parts may be disabled. For example:
If you select Graph: Cost under the Data group, the top section will show the resource cost, but the middle section will be disabled. This is because when considering the cost aspect, there is only allocation, no overallocation.
The style of the bar shown in the above figure is vertical. There can be others as well, such as Area, Step, Line, and Step Line. You may also choose not to display a bar style in any one of the aforementioned three sections for a single resource or a group of resources.
Key Points about Resource Graph
To operate within this view effectively and efficiently, you need to understand certain key points. They are explained in the video [duration: 5m 12s], which I’ve prepared in support of this article. For the best experience, you may want to go full-screen in HD mode and plug-in your earphones.
With these fundamentals in mind, let me explain a bit more about the graphical data representation of the Resource graph.
Resource Graph Data Representation
The Resource Graph view’s data representation is driven by measurement chosen under Graph: command within the Data group under the Format tab as shown below:
As we have seen earlier, by default, the Peak Units will be chosen, but you can switch among the data/measurements, as per your need. For example:
Work is the amount of work assigned. The unit will be taken from the Global settings of MS Project.
Cost is the cost of assignments. This unit also will be taken from the Global settings of MS Project.
Peak Units are the largest percentage of effort (peak) assigned to a resource within a time period. Do note that Peak Units refer to the effort assigned, not the work assigned.
Overallocation refers to the work overallocation of the resource.
Cumulative Work is the total amount of work assigned till date.
Remaining Availability is the effort remaining, i.e., still available for assignment. This unit will also be taken from the Global settings of MS Project.
Usages of Resource Graph *** UPDATED ***
The Resource Graph can be used as a visual display and can really help you to solve a number of problems with regard to scheduling, costing, resource assignment, resource leveling, etc. I will cover five ways to use the Resource Graph view now.
Usage – 1: Checking Resource Availability
The availability of a resource can be checked before you assign a resource to a task. This is very useful as you launch the Resource Graph view from Assign Resources option (as we saw earlier) and see displayed the remaining availability of a particular resource.
As shown above, the availability of the resource is shown with vertical blue bars. If the resource is fully occupied, blue bars won’t be available for those respective days.
With this application, you will also easily see the current resource(s) working on a selected task above in the Gantt Chart view and can determine what others can be allocated.
Usage – 2: Viewing Proposed Booking
You might be wondering about the purple bars in the previous figure. As indicated in the graph, these show proposed booking.
Resources, when added to MS Project, can be either committed (this is the default) or proposed. Committed resources are ones which are definitely available, whereas proposed resources refer to those for which you unsure of availability.
Now, for the same resource (Satya Dash) in the previous figure, I can double-click on the resource and change it to proposed by going to the General tab of the opened Resource Information Dialog box.
The graph in the timescale portion of the view will change, as shown below.
As you can see, the vertical purple bars are now changed to blue, and the availability is also shown. This can be reconfirmed by changing the Remaining Availability in the bottom right part of the legend section to Work. You have to use the Graph: option under the Format tab to switch to work data in the Graph. It’s shown in the below figure.
Usage – 3: Checking Overallocated Resources
As you may have noticed in the previous figure, a red colored coding has appeared in the legend section of the Resource Graph. This, as informed by the indicator column, is for overallocation.
However, the current resource assigned to the task of “PRD Approval” is not overallocated. Rather, there is an overallocation indicator (red person icon) in the indicator column for the task, “PRD Preparation,” – the task just above with Task ID 4.
You may be wondering how will you know why, when, and which resource(s) is/are overallocated for the concerned task?
In this case, the concerned task is “PRD Preparation.” To know more, we will change the top panel of the split view to Resource Usage view, while keeping the bottom half as it is. The split Resource Usage view with the Resource Graph view is shown below.
The resource assigned to the PRD Preparation task (John Robinson) is clearly highlighted as red, which means this resource is overallocated. This is also reflected in the Resource Graph view in the bottom pane.
I’ve changed the data part of the Resource Graph to display Peak Units, which informs the highest assigned resource units (in terms of effort) within a time period. You can switch to other options, and corresponding values with indications for overallocations will display.
For example, in the below figure, instead of Peak Units, now we’re looking at Overallocation data for the Resource Graph in the bottom pane, and it’s showing the only overallocation in hours.
Usage – 4: Adjusting Critical Resources
There is another very useful scenario for which the Resource Graph can be used. To compress the schedule of the project, it’s natural for a project manager to look at the critical path and the critical tasks. There are many ways to look this data, such as using Tracking Gantt view or formatting options in Gantt chart. The problem lies in that with these views, you really won’t know which resources are free and if they can be employed in critical activities.
In such cases, it’s useful to bring up the Resource Graph view in the bottom half of the Gantt Chartview and see first if a resource is available for the concerned tasks. One such scenario is shown below.
While the resource (Mohan M R) is occupied with the “Design and Develop Backend – 1” task, he is actually also available for “PRD Preparation” and “PRD Approval” tasks. This is shown with the Remaining Availability data view of the Resource Graph and highlighted with the blue color in the bottom pane of the split view.
Note that both of these tasks are also critical tasks. This is shown with a light red color in the Gantt Chart view at the top of the split.
You may be wondering if the concerned resource can now be utilized in these critical tasks to compress the project schedule. The answer is yes! The PM can analyze this scenario and reduce the schedule from here.
Usage – 5: Knowing the Cost Distribution Over Project Life Cycle
With the Resource Graph view, you can see the total cost distribution of a project over its life cycle. This can be shown by enabling a group of resources and using the Cost data from the Graph: command under the Format tab.
As shown, we have the cost distribution of the project over its life cycle, which is low during the initial stages, goes-up in the middle. and tapers off towards the end of the project.
You can also show the cost of a specific resource along with the total project life cycle cost as shown below.
Finally, you can copy the Resource Graph view using the Copy functionality given in MS Project. This is shown below.
The Resource Graph view is a powerful feature in MS Project, and I hope with this article has given you a fair understanding about the usage of this view.
While interacting with MS Project users across a couple of industry verticals recently, I encountered a question from a senior mechanical engineering lead regarding Planned and Actual Percent Complete fields. The lead was managing a bridge construction project in the Middle East.
The client’s requirement was to show both Actual Percent Complete and Planned Percent Complete in the MS Project Plan. The (Actual) % Complete should have been visible in the tabular view of the Gantt Chart and in the generated histogram reports for L2 or L3 tasks of the work breakdown structure, but MS Project doesn’t have a Planned % Complete field. This had to be created.
Another problem the engineering lead faced was getting negative values while having the planning percent complete with the created custom fields formula for the milestones. Obviously, this stemmed from the way the formulas were put in!
Inspired by his project, I decided to write this article on the topic of Planned and Actual Percent Complete data within MS Project. We will explore the concept of Planned Percent Complete and how to track it using the custom fields available in MS Project. I will also show the scenario by insertion of the milestone/task and recalculation. In the end, I’ll be creating a histogram report which compares the Planned and Actual Percent Complete.
Fundamentals–Baseline and Status Date
As a management professional, you need to understand that comparison always happens against the latest baseline after one sets the status date. Many miss this aspect. The whole idea of having a baseline is to have a comparison and measure progress.
To explain how to spot this comparison, I’ve created the below video [Duration: 3m:44s]. For the best experience, you may want to go full-screen in HD mode and plug-in your earphones.
With these fundamentals in mind, let’s proceed to checking a few functions and fields in MS Project.
Functions and Fields
MS Project becomes a very powerful tool when you use its custom fields, functions, and build your own formulas. Rarely a software project management tool comes with such a large number of in-built fields and functions. For the purpose of this article, we are going to use the Date() function.
ProjDateDiff
As per MS Project software API documentation, this function returns the duration between two dates in minutes. Hence, when we wish to calculate in days, we have to divide by 480, because a day will have 480 minutes.
Syntax:
ProjDateDiff( date1, date2, calendar )
In this function:
date1 (required field): The date used as the beginning of the duration.
date2 (required field): The date used as the end of the duration.
calendar (optional): The calendar to use when calculating the duration.
DateDiff
Another widely used Date() function is the DateDiff() function, which, as per MS Project software API documentation, also returns a time interval between two dates in a long format.
interval and dates (required fields): The interval time between date1 and date2.
firstdayofweek and firstweekofyear (optional fields): The first one is a constraint constant that specifies the first day of the week, whereas the second one is a constraint constant that specifies the first week of the year.
For the sake of example, I’m going to use the ProjDateDiff() function. Nevertheless, you can use the DateDiff() function, as well.
Fields Used
Of the available built-in fields in MS Project, we are going to use:
Baseline Start: Gives the baseline start date of the task.
Baseline Duration: Gives the baseline duration of the task.
Status Date: Gives the status date of the project.
The Project Plan
As you can see, we have the below project with its phases, work packages, and milestones.
Note:
There are two phases, Phase 1 and Phase 2.
Each phase has four work packages and ends with a milestone.
I am going to show you how to put in formulas to calculate the Planned % Complete for all the tasks in MS Project.
Steps Involved
To build and calculate the formulas, I’ll follow five steps.
Step – 1: Set the Baseline
As I’ve said before, without setting the baseline, we can’t do the calculation. To the set the baseline, go to the Project tab > Schedule group > Set Baseline. Then, execute the “Set Baseline…” command, as shown below.
Step – 2: Set the Status Date
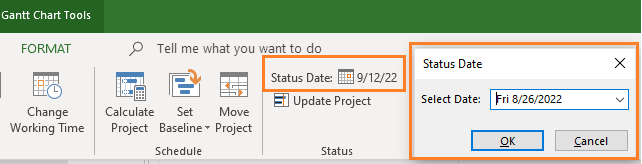
Next, we are going to set the status date, for which you have to go to the Project tab > Status group, and use the “Status Date:” command.
Note that as one works with the project and its progress, the status date can be updated accordingly.
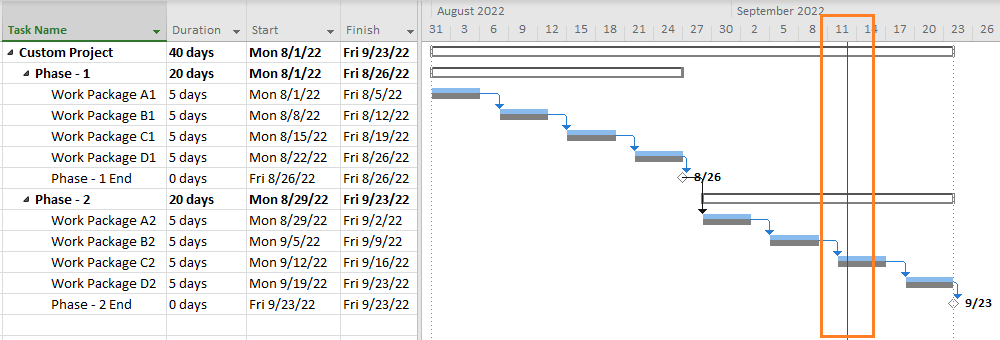
You may want to see the status date in the Gantt chart view, which can be done by going to the Format tab > Format group > Gridlines, and executing the “Gridlines…” command.
For the sake of this example, I’ve set the status to show with a normal line and red color coding. The status date will be visible now in the Gantt Chart View along with the baseline. This is shown below.
Step – 3: Create the Needed Custom Fields
For the purpose of our calculation, we are going to have three number custom fields and one text custom field:
Number1: This will hold the difference between the status date and baseline start.
Number2: This will hold the baseline duration of the task concerned.
Number3: This will hold the formula comparing the position of the status date with respect to the baseline values.
Text1: This will convert the “Number3” into percentage representation.
To use these custom fields, go to the Format tab > Columns group, and execute the “Custom Fields” command.
As highlighted above, we will be using three number custom fields (and a text custom field). Ensure that the formula is applied and the calculation for task and group summary rows use the formula embedded into the appropriate custom field.
Step – 4: Determine Planned % Complete
For each of the three number fields, we will be using these formulas.
The Number1 field will hold the value of difference between Baseline Start and Status Date. If the Status Date is ahead of the Baseline Start, then it will be positive, whereas if behind the Baseline Start, it will be negative.
Number2: [Baseline Duration]/480
This will hold the Baseline Duration of the task.
Number3:
IIf([Number1]<=0,0,
IIf([Number1]>=[Number2],100,
IIf(([Number1]<[Number2]) AND ([Number2]>0),
[Number1]/[Number2]*100,0)))
This custom field holds the main algorithm and uses the IIf() function of MS Project. The algorithm is built on explanations given in the first video.
Step – 5: Format Planned % Complete
Finally, we will convert the Number3 custom field into a Text one. I’ve used the below formula for the Text1 custom field:
Text1: cStr([Number3] & “%”)
We need to concatenate the string value of Number 3 with “%.” The “Text1” custom field also has to be renamed as “Planned % Complete”.
After you have populated the custom fields with the above formulas, you’ll see the below.
Let’s interpret the above figure:
The status date is set as Sept 12, 2022.
For Phase – 1:
All tasks (work packages) are planned to be completed by the status date. Hence, these are shown to be 100% complete.
The cumulative planned % complete for Phase – 1 is at 100%.
For Phase – 2:
“Work Package A2” and “Work Package B2” are planned to be completed fully. Hence, these are shown as 100%.
The status date is 1 day into “Work Package C3,” because it starts on Monday, Sept 12, 2022. Hence, the planned % complete for this task will be 1/5 = 0.2 or 20%.
The cumulative planned % complete for Phase – 2 is at 55%.
The cumulative planned % complete for the entire project is 77.5%.
Planned Vs. Actual Percent Complete
Now that we’ve walked through how to calculate and use the Planned % Complete, let’s look at it alongside the Actual % Complete column. As noted earlier, “% Complete” in MS Project informs on the actual percentage completed for a task. To show both, I’ve added one more column into the tabular side of the Gantt Chart, as depicted below:
I’ve renamed the title field for “% Complete” by going to the Format tab > Columns group > Custom Settings, and executing the “Field Settings” command.
As we track the project’s progress, both planned and actual percent complete fields will populate, respectively, as shown.
Let’s interpret the above figure:
The status date is again on Sept 12, 2022, when we started tracking.
For Phase – 1:
As on the status date, Work Package A1 and B1, as well the Milestone “Phase -1 End,” are actually complete, and, hence, are all showing to be at 100% completion.
Work Package C1 started on time, but took 2 more days to complete.
Work Package D1 has seen 2-days’ worth of work, but has 4-days remaining. While the actual % complete is 2/6 or 33%, the planned percent complete is 100%, as we have seen earlier.
The cumulative actual % complete for Phase – 1 is 83%.
For Phase – 2:
Work Packages A2 and B2 are at 75% and 50% actually completed. Compared to the status date, the planned percent complete is 100%.
Work Package C2 has seen 1-day’s work and still has 6-days of work remaining. Hence, the actual % complete is 1/7 or 14%, whereas the planned % complete is 20%, as we have seen earlier.
The cumulative actual % complete for Phase – 2 is at 33%.
The cumulative actual % complete for the entire project is at 58%. On the other hand, as seen earlier, the cumulative planned % complete is 77.5%.
More on Planned % Complete
There are certain scenarios where ‘#ERROR’ notifications are shown in the MS Project software. These confound many MS Project practitioners, and I felt that exploring a few such scenarios would be best done in the below video [Duration: 6m:07s], which I’ve created for this article. The scenarios explored are: No Status Date, No Baseline, Addition of New Tasks and Re-baseline.
Creating Histogram – Planned Vs. Actual % Complete
So, what do we do with the data? MS Project comes with a large set of built-in reports, as well as allows you to create your own customized reports. Let’s create a histogram to show the Planned vs. Actual % Complete data to a customer or stakeholder.
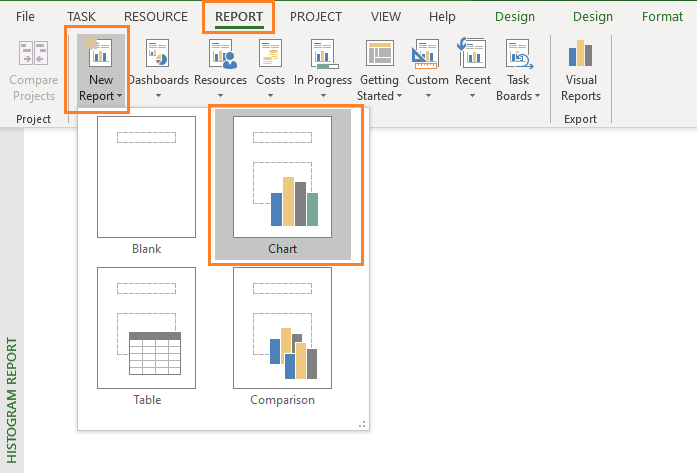
Create a custom Histogram Report by going to the Report tab > New Report > Chart, as shown below.
Select the custom field related to Planned % Complete and the already available field of (Actual) % Complete in the “Field List.” The histogram report will show both these fields in its report.
With a little bit of further customization, labelling, axis value population, and formatting, the histogram report will come out as shown below.


.png)