Sunday, August 21, 2022

Management Yogi's Hybrid-Agile (CHAMP) Certification: Managing A Hybrid-ScrumBan Project with MS Project Agile


Many times, managing a Hybrid-Agile project with a sole Lean-Agile approach doesn’t meet the needs of an organization, the expectations of stakeholders, required delivery frequency of customers, or address uncertainties associated with engineering work. In certain cases, it may be necessary to employ multiple Lean-Agile approaches to manage hybrid projects.

For example, in some projects, it’s possible that you are employing a traditional or predictive (i.e. Waterfall) approach for certain phases of the project, followed by an Agile approach for subsequent phases. In the phases with an Agile or adaptive approach, you want to have a combination of adaptive approaches – say a combination of Scrum and Kanban.

Such a model would be called a Hybrid-ScrumBan project. This is because you used the frameworks of Waterfall, Scrum, and Kanban within a single project! I’ve derived the word ScrumBan by combining Scrum with Kanban.

To best understand our Hybrid-ScrumBan scenario, we will proceed using MS Project.

Hybrid-ScrumBan Scenario *** UPDATED ***

In our scenario, a construction organization is building a “Smart” home. This project is built-upon a previous article in which I explained the management of a Hybrid-Scrum project. I strongly suggest that you read that one first to understand this piece better.

This project is largely focused on development, employing both Waterfall and Agile. The security related features are to be delivered in a number of Sprints, following the Scrum framework. The features completed will be first delivered to a team of internal customers within the organization. This group will get the first opportunity to check the features and raise their concerns, expectations, or issues, before it goes to the actual customers.

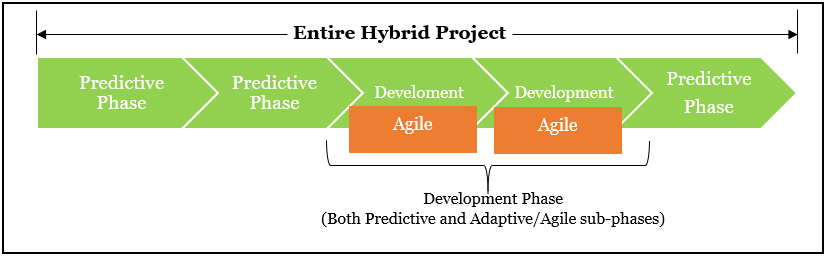
When features are delivered to the internal customers, they will raise tickets. These internal customer tickets will be fixed following the Kanban framework. As you can see, in this case, we’ve already employed Waterfall, Scrum, and Kanban making this a Hybrid-ScrumBan project. It’s represented in the following figure.


In this Hybrid-ScrumBan project:

  • The first few phases, such as Start-up and Planning, occur only in the Waterfall or Predictive mode.
  • The large Developmental phase employs both Predictive and Agile approaches. It's highlighted with blue color coding. Specifically, I’ve set up a Scrum framework which will run in parallel to the Predictive development work. The security features will be developed in the Scrum mode. It's highlighted in pink.
  • Subsequent to the Development phase, there is another Kanban phase, where the Kanban team will fix all the tickets raised. Note: It’s possible that there will be some overlapping between the development work and ticket fixing work. This phase is highlighted in greeen color coding. 
  • Towards the later part of this construction project, we have phases such as Test, Deploy, and Close, which are again following a Predictive mode.

Let’s start with planning for the Traditional part!  

Begin with the Traditional

This part of the project is somewhat straight forward with all the possible phases and associated tasks arranged. As you work on it, we have the following view in MS Project Online Desktop Client, which contains the Agile features.


As you can see in the Development phase, we have two sub-phases:

  • Predictive Home Development, which is in Waterfall mode with all tasks clearly defined.
  • Scrum Home Security Development, which is in Scrum mode (a placeholder for now). We will build this portion next.

Build the Scrum Part

The security related features are to be delivered over the Sprints and so, I’ve added the features under the Scrum Home Security Development sub-phases. The word “Feature” prepends each of these tasks to distinguish them from other task items in the project.

The fundamental block in Scrum is the Sprint, which actually sets the heartbeat of Scrum with its weekly, biweekly, or any other cadence. Hence, we will plan for the Sprints by going to the Project tab > Properties group > Manage Sprints command.

As shown, I’ve created five Sprints for this project, each with a two-week duration.  

Next, we have to break-down the features into tasks, and associate the Sprints with the features and tasks. We also need to add all the Scrum events, which results in the following view:


Note the following:

  • Features for Sprint 1 have been broken down into tasks and associated with the first Sprint.
  • All Scrum Events such as Sprint Planning, Daily Scrums, Sprint Review, and Sprint Retrospective are available for the current Sprint. To understand more about how to build a Sprint Backlog, you can refer to this article.
  • Scrum related items are associated with the IsAgile custom field, which informs if the work item is Agile related or not. To understand how this field is going to help in a Hybrid-Agile project, you can refer to this article.
  • The Show on Board built-in field has been associated with the needed items for the Scrum part of this Hybrid-ScrumBan project.
  • Other features, such as Feature – Smart App Integration, Feature – 24*7 Monitoring, etc., are associated with other Sprints such as Sprint 2, Sprint 3, Spring4, and Sprint 5.

The featured items to be delivered over the Sprints can be seen in the Sprint Planning Board view.

At this stage, our project is still a Hybrid-Scrum project, not a Hybrid-ScrumBan project! For that, we have to follow some more steps, which we will do next.

Build the Kanban Part *** UPDATED ***

As explained earlier, the internal customer raised tickets will be addressed in Kanban mode.

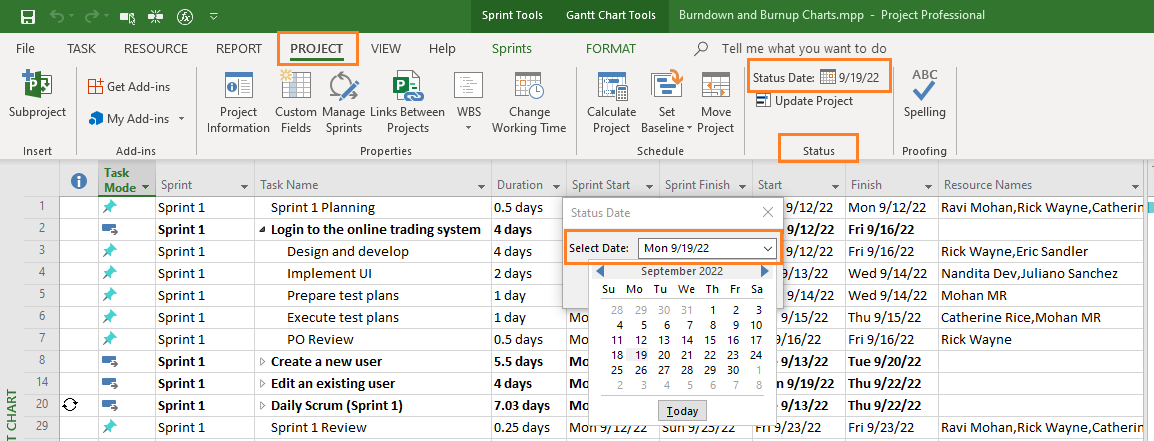
Let’s assume the current Hybrid-ScrumBan project has progressed for some time and we have completed one feature within Sprint 1: Feature – Smarty Entry.

The above shown figure is the current situation within our project on the status date, which is set to Monday, 17th October’22. The status date is in red color coding and it’s highlighted.

As shown in the above figure:

  • The Scrum team has completed Feature – Smart Entry, and all its associated tasks. It’s showing 100% complete in % Complete built-in field. It's a good idea to add this field when you track. 
  • Events such as Sprint 1 planning and a few Daily Scrums are completed. This is shown with the tick mark in the indicator column.
  • A number of Phases for the Predictive/Waterfall part – the Start-up and Planning phases – are also complete.  

As this feature was completed, it was delivered to the internal customer team. The team raised a number of tickets, which have to be fixed by the Kanban team. Hence, we have to add those tasks and plan for them in our project.

For this purpose, I’m going to add another phase in the current Hybrid-Scrum project, named as Kanban – Internal Customer Review. In this phase, we are can plan for all the tickets and assign the Kanban team members accordingly.

As shown in the above figure:

  • There have been five tickets raised by the internal customer team, which are under the Kanban – Internal Customer Review phase. These have been assigned to Kanban support engineers.
  • None of the tickets under this phase have any Sprints associated with them because the team is fixing the issues on-demand—and, of course, Kanban doesn’t have a concept of Iteration or Sprint. This is highlighted as “No Sprint” under the Sprint column for the ticket items.

Next, we are going to add another custom field to distinguish between the Scrum and Kanban work items of this project. This will be needed for further visualization, grouping, filtering, tracking, adjusting, monitoring, among others.

The custom flag field will be a IsKanban field, which will be enabled only for Kanban work items. With it, the view is shown below:

Note: we have enabled the IsKanban field only for the Kanban related work items.

In addition, here some important points:

  • Show on Board field has been enabled for Agile related items, including both Scrum and Kanban work items, except a few, depending on the need.
  • The IsAgile custom flag field has been enabled for all Agile related items – both for Scrum and Kanban work items.
  • Sprint Start and Sprint Finish dates are included because it helps to parallel plan (features’ planning in Scrum mode and tickets’ planning in Kanban mode).

Integrated Hybrid-ScrumBan Project

Now our Hybrid-ScrumBan project is ready! This is shown in the below figure with clear segregation between the Waterfall, Scrum, and Kanban parts of the project.

At this stage, you might be wondering:

  • Can one visualize only the Scrum part of the project in Scrum Board and Sheet views?
  • Can one visualize only the Kanban part of this project in different views?
  • Are there really any separate Kanban views to visualize?

The answers to the above questions are: yes, yes, and yes!

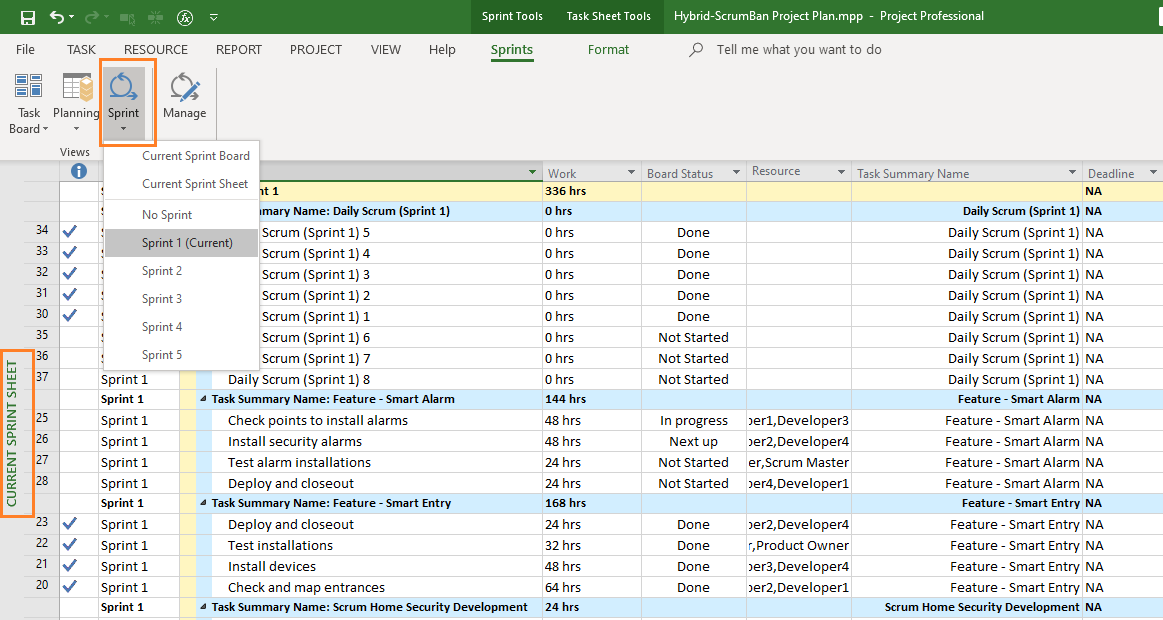
To visualize only the Scrum part of the project, you can use Sprint Planning Board and Sprint Planning Sheet views. You can also use the Current Sprint Board and Current Sprint Sheet views. Below is a depiction with the Current Sprint Board view.


To see it in a spreadsheet representation, you can use the Current Sprint Sheet view. In the below figure, I’ve applied a custom grouping with Sprint and Task Summary Names.

To visualize only the Kanban part of the project, you can use Task Board and Task Board Sheet views. You can also use Backlog Board and Backlog Sheet views. Below is a depiction with the Task Board view.


Do note that I’ve applied the custom Kanban filter in this Task Board view. This is highlighted in the above figure. The Kanban filter takes the previously created IsKanban field and ensures only Kanban related items are shown in this view.

You can also see the work items in the Kanban part of the project in the Task Board Sheet view. This is explained in more detail in the below videos.

In the above figure, I’ve applied the built-in Board Status group, which informs on the Kanban work items falling under individual workflow states of the Kanban board.

Analysis and Key Points

Now, let’s have the analysis, followed by some important points to manage Hybrid-ScrumBan in the below videos, which I’ve prepared for this article. The content is taken from my new course: Certified Hybrid-Agile Master.

Because Hybrid-ScrumBan projects are quite complex, I’ve divided this content into two videos to cover multiple key points. The first part is explained in [duration: 6m: 18s]. For the best experience, you may want to go full-screen in HD mode and plug-in your earphones.


The second part [duration: 4m: 29s] elucidates further key points and is in continuation of the previous video. This part emphasizes a mindset change as you traverse through the Waterfall, Scrum, and Kanban parts of the project.


Conclusion

Organizations do combine multiple Agile approaches (for example, Scrum with Kanban), but such are most often considered to be a Blended Agile model, not exactly a Hybrid one.

While such Blended Agile projects can be managed, when it’s a Hybrid-Agile project with a single Agile framework, the complexity goes-up. For a project employing multiple Agile approaches, along with predictive mode, the complexity goes even further.

This is because of a wide array of principles, practices, artifacts, roles, responsibilities, and associated events. In addition, as you work to create a hands-on tool, you also need to have a sound understanding of the software tool being used to manage such Hybrid-Agile projects.

It’s my sincere hope that you got a fair understanding of managing a Hybrid-ScrumBan project with MS Project. As always, your comments, feedback, and suggestions are welcome.

--

This article was first published by MPUG.com on 1st February, 2022. This is a refined and updated version.


References

[1] NEW Certification Course: Certified Hybrid-Agile Master with MS Project, by Satya Narayan Dash

[2] NEW Online Course: Mastering MS Project 2019 Agile (Scrum and Kanban), by Satya Narayan Dash

[3] Online Course: PMI-ACP Live Lessons, Guaranteed Pass, by Satya Narayan Dash

[4] e-Book: I Want To Be A PMI-ACP, Second Edition, by Satya Narayan Dash


Monday, August 15, 2022

Management Yogi's Hybrid-Agile (CHAMP) Certification: Building and Managing A Hybrid-Agile Plan with MS Project


While Scrum and Kanban are two frequently used, individual Lean-Agile frameworks, many management practitioners use Hybrid-Agile approaches. This is because a number of organizations, across industry verticals, don’t explicitly follow any prescribed framework, but customize according to their organizational needs.

When a combination of predictive, iterative, incremental, and/or Agile approaches are applied to projects, we see what we call a “hybrid” approach. Simply put, Hybrid-Agile methodology is a combination of Agile and non-Agile approaches. 

With MS Project software, there is capability, not only to manage stand-alone frameworks such as Scrum or Kanban, but also for management of a variety of Hybrid-Agile approaches. In fact, almost all possible Hybrid-Agile approaches can be managed within the MS Project software using its Agile features. The Agile, as well as all traditional features, are available in MS Project 2019 Online Desktop Client.

The content of this article has been taken from the new Certification course:

In this article, I will explore how to create an end-to-end Hybrid-Agile plan with MS Project 2019 software starting with a Traditional Waterfall project. We will convert the project to a Hybrid-Scrum model partially executed with a number of Sprints (or iterations). We’ll build Sprint plans within the project and manage the integrated Hybrid-Agile aspects. Towards the end of this article, I will demonstrate what I feel are the key points and conclude with a discussion on the relevance and importance of Hybrid-Agile management with MS Project.

Hybrid Models *** UPDATED ***

As stated, a hybrid methodology takes elements from two or more methodologies and combines them – ideally, it’s the best of both.

Hybrid models can look a variety of ways:

  • Agile-Predictive hybrid model, i.e., the first few phases in an Agile mode, followed by others in a Predictive mode.
  • Predictive-Agile hybrid model, i.e., the first few phases in a Predictive mode, followed with others in an Agile or Adaptive mode.
  • Combined Agile and Predictive model, i.e., both Agile and Predictive modes are being used throughout the project life cycle.
  • Predominantly Predictive with Agile model, e., almost all the work is done in a Predictive mode, but few components are in an Agile mode.
There can be other Hybrid-Agile models as well. Before you prepare the plan, you need to understand which model is being followed. This will enable you to have a flexible plan, which can be scaled and adjusted as per your need.

Our Scenario

In this example, a construction organization is building a “Smart” home. The security part of the home will be executed in Agile/Adaptive mode and will specifically follow the Scrum framework. The construction part of the project will be following the Waterfall or Predictive mode. Hence, we have a combination of Predictive and Adaptive approaches, making it a Hybrid-Agile project.

The following representation should provide clarity: 

As shown in the figure, the project has many phases, including a large Development phase, with both Predictive and Agile development elements.

With this basic understanding, let’s start building the traditional part of the project with MS Project software.

Build the Traditional Project

We have the following high-level phases:

  • Start-up, which will start off work for the project.
  • Planning, which will have planning for both the Predictive and Adaptive/Agile aspects.
  • Development, which in turn is divided into two sub-phases:
    • Predictive Home Development: It’ll have work related to the traditional development mode.
    • Agile Home Security Development: It’ll have all the adaptive development work and related Sprints, as we are following the Scrum framework.
  • Test: This phase will have integrated testing combining the work from the “Predictive Home Development” and “Agile Home Security Development” phases
  • Deploy: We will have two phases of deployment.
  • Close: All work related to the closeout of the entire project.

To plan this project, we will use the Gantt Chart view in MS Project and set up as shown below: 


A few key things to notice:

  • Under the “Development” phase, we have two sub-phases.
    • Predictive Home Development, following the Waterfall model.
    • Agile Home Security Development, following the Scrum framework.
  • All the tasks in Predictive development phase are linked, as indicated by the Predecessors column of the Gantt Chart view. I’ve not linked most of the tasks under the Agile mode because, in Agile, the team is self-organizing and self-managing. However, you can always add dependencies as needed.
  • Some of the task items in the Agile/Scrum mode are prepended with the word, “Feature -” to indicate them as such (i.e., Feature – Smart Entry). These will be broken down into tasks shortly as we go on with our Sprint Planning.

Scrum related work items/tasks are considered differently because, in Scrum projects, we really don’t know about the complete plan (hence, the tasks) in advance, and the plan is progressively elaborated with repeated usage and rolling wave planning for every iteration or Sprint. This project work breakdown structure follows a combined Predictive and Adaptive model.

Plan for the Sprints

Next, we will be planning for the Sprints because we are following Scrum for the “Agile Home Security Development” phase. To do so, go to the Project tab and click on the Manage Sprints command under the Properties group. 

It’s significant to understand this because when we started with a traditional project, we did not have any Sprints at all. Now, look! We are going to embed the Sprints into our traditional project, which will convert the project into a Hybrid one.

The execution of the Manage Sprints command will generate the below dialog box, where I’ve planned for three Sprints, each with a two-week duration.

As you add each Sprint to your project, Sprint Tools will be enabled, along with the Gantt Chart tools. This is because the project now is in Hybrid-Agile mode.

Add the Custom Field

Now, in the Gantt Chart view, I’ll have two fields (columns) added:

  • Show on Board: This is a built-in field from MS Project, and it informs if you want to show the task item in the Sprint Planning Board and Current Sprint Board.
  • IsAgile: This is a custom flag/boolean field, and it informs if the concerned task item is part of Agile mode or not. This field is very useful as we do Agile reporting, grouping, sorting, filtering for this Hybrid-Agile project.

To add the above custom field of “isAgile,” you just have to go to the Format tab on the Ribbon and create it as a custom field. 


As shown above, the “IsAgile” field has been enabled only for the Agile work items. The “Show on Board” field has been enabled for some of the Agile work items, specifically the feature items.

Associate with the Sprints *** UPDATED ***

We now have three Sprints (Sprint 1, Sprint 2, and Sprint 3), and we have to associate the appropriate features with these Sprints. To do this, we will use the Sprint Planning Board. Access it by going to the Sprint Tools > Sprints tab > Planning command and selecting the Sprint Planning Board command.

To associate the Agile features with Sprints, simply drag and drop the features to their respective Sprint columns. This will result in the following view:

As shown, we have two features (Smart Entry and Smart Alarm) planned for Sprint 1, one feature (24 by 7 monitoring) planned for Sprint 2, and one feature (Advanced Security Features) planned for Sprint 3.

One can associate the features with respective Sprints in the Sprint Planning Sheet view as well. For that, you have to simply select the Sprint from the drop-down list and associate. 

Coming to the Gantt Chart view, I’ll add another built-in field (column) called Sprint. This field informs which items are associated with their respective Sprints, and is shown in the below figure with the features and Sprint column highlighted. 


As you can see, the Agile feature-related tasks are now perfectly associated with the respective Sprints. Also, do note that for other Agile tasks (and Predictive tasks), it’s showing, No Sprint.

Build on the Current Sprint Plan

Next, we are going to build on the first Sprint (Sprint 1) and create our Sprint Plan under the Hybrid Project. You can use the Sprint Planning Sheet view for this purpose. However, I’ll remain in the Gantt Chart view as it gives a full perspective for both parts – Predictive, as well as Adaptive.

Remember, in Agile, the planning will be Just-in-Time (JIT). We don’t plan for all the Sprints in-detail, just for the upcoming one.

As we build the plan for Sprint 1, in the Current Sprint Plan (or Sprint Backlog), we will have:

  • Sprint Planning event,
  • Sprint Review event,
  • Sprint Retrospective event,
  • Daily Scrums, and
  • Features broken down into individual tasks.

After creating these events, adding the recurring tasks for Daily Scrum, and breaking down the features into their individual tasks, we will have the below view. This linked article informs on how to create a Sprint Backlog (Sprint Plan) with all the Scrum events and broken-down tasks. 

At this stage:

  • The features in Sprint 1 are broken down into tasks.
  • The “Feature – Smart Entry” has been broken down into multiple tasks, so also has the “Feature – Smart Alarm.”
  • All Scrum events, along with the Daily Scrums for this Sprint, have been added.

Do not forget to associate the broken-down tasks with the “isAgile” field and the current Sprint.

Integrated Hybrid Project

Now that we have the tasks for both Predictive Home Development and Agile Home Security Development, we can visualize and work on the Integrated Hybrid project.

I’ll be associating the planned start and finish dates for the tasks, as well as the Scrum events created and dependencies. For example:

  • Sprint Planning meeting will be the first event of the current Sprint.
  • Sprint Retrospective will follow the Sprint Review event and so on…

I’m also going to apply resources for both the Predictive and Adaptive work of the entire Hybrid project.

With this, our final view for the Development part, including both Predictive and Adaptive parts, will be as shown below. 

For the above Hybrid-Agile project, in both the predictive and adaptive areas, we have:

  • The durations, needed dependencies, and resources
  • Two new columns, Sprint Start and Sprint Finish, which are built-in MS Project fields (this helps in planning with respect to the Current Sprint 1’s tasks)

Hybrid-Agile Sheet and Board Views

In the previous Gantt Chart view, we have a combined view for both predictive and adaptive parts. If one wants to specifically check the Agile part of the Hybrid project, the Sprint Planning Sheet view can be used.

I’ve applied a custom grouping to view all three Sprints. The first level is by the Sprint, whereas the second level is by the Task Summary Name. 

Now you may be wondering:

  • Can I view the Sprint Planning Board view?
  • Can the tasks for Sprint 1 be seen in the Current Sprint Board view?

Absolutely! This is because, earlier we enabled the tasks to be shown on the Boards – Sprint Planning Board or Current Sprint Board. You can go to the Current Sprint Board view via Sprint tools > Sprints tab > Sprints menu > Current Sprint Board command. 


As shown, you can also choose the Sprint 1 (Current) command to see the current Sprint’s board. You can then see the content of the board, which is depicted next: 


In the above view, we have the work items for the Current Sprint (Sprint 1) shown (i.e., the subtasks, “Sprint 1 Planning” and “Check and map entrances”).

The Current Sprint Board view will be subsequently used for tracking – specifically for the Agile task items. A tracked board is shown below. This is explained further in my upcoming video.


Considerations and Key Points: Hybrid-Agile Management

Since the start of this article, we have come a long-way in building and visualizing a Hybrid-Agile project. Now let me provide a demonstration of this plan we’ve created and review a few key points. They are explained in the following video [duration: 10m: 09s], which I’ve prepared in support of this article. The content is taken from my new course, Certified Hybrid-Agile Master with MS Project. For the best experience, you may want to go full-screen in HD mode and plug-in your earphones. 


Conclusion

An individual Lean-Agile framework, per-se, is less likely to be used as the only prescribed model for many organizations. In fact, a 2017-18 report on Scrum informed that a large number of practitioners were using Waterfall, Scrum, and Kanban together. In another report for Scrum Master trends in 2019, a combination of approaches being used went beyond 80%. Hence, Hybrid-Agile projects and their management are a reality and must-have for project management practitioners.

The MPUG team conducted a survey among MS Project practitioners asking for members to share the biggest frustration, issue, bug, or pain point with MS Project software tool. One of the top frustrations was that MS Project is not the best tool for Agile!

Whether MS Project is best or not is opinion specific and subjective; however, as we saw in this article, everything you need to do to manage a Hybrid-Scrum project can be done with the MS Project tool. You can also operate a large variety of Hybrid-Agile projects and models, some of which we listed earlier.

I hope you’ve gotten an in-depth understanding of how to build and work within a Hybrid-Agile (Scrum) project using MS Project. As always, your feedback is welcome in the comments section below.

--

This article was first published by MPUG.com on 30th November, 2021. This is a refined and updated version.

References:

[1] NEW Online Course: Certified Hybrid-Agile Master (Theory and Practical) with MS Project, by Satya Narayan Dash

[2] NEW Online Course: Mastering MS Project 2019 Agile (Scrum and Kanban), by Satya Narayan Dash

[3] Online Course: MS Project Live Lessons, by Satya Narayan Dash


Monday, August 08, 2022

Single View – Multiple Sprint Burndowns with MS Project Agile


The Sprint Burndown and Burnup charts can be created for the current Sprint in an Agile project, as we have seen before. Some of you may now wonder: is it possible to show multiple Sprint Burndown or Burnup charts in a single view? This is because you are running multiple Sprints in your project and you want to visualize all the burndowns in a single view or report. The short answer is yes! With MS Project 2019 Agile you can. A single view of multiple burndown charts is also useful in certain scenarios.

In this article, I’ll explore how to create a number of Sprint burndowns in a single view. For example, if a project is having three Sprints, we can see all these burndown charts together.

I’ll strongly recommend that you read the previous article of working with multiple Sprints, before proceeding with this one. You also need to know how to build the Sprint Burndown chart, for which you can refer to this step-by-step article

The content of this course has been taken from two new courses. These are in-depth courses to master Agile and Hybrid-Agile with a hands-on software tool. 

We will follow a step-by-step approach to build this Multiple Sprint Burndowns in a single view:

  • Current Scenario
  • Default Burndown Chart
  • Applying the Filters and Groups
  • Customizing the Multiple Sprint Burndowns
  • Interpretation and Conclusion

Current Scenario 

In our project, we have the following scenario:

  • We have three Sprints planned: Sprint 1, Sprint 2 and Sprint 3
  • Sprint 1 is fully complete. Sprint 2 is underway and we are mid-Sprint for this one. Sprint 3 is yet to get started.
  • A number of feature items are unplanned and we may take them in some future Sprints.

The project is shown below with the Gantt Chart view. 


As you can see in the above figure, we have three Sprints (with the respective percentage complete) and for the feature items, the feature custom flag is enabled.

Default Burndown Chart

Now, we are going to create the burndown chart. For this purpose, I’ll go to the Reports tab > View Reports group > New Report and create a blank report. I’ve given the name for this report: Single View – Multiple Sprints Burndowns. 

Now, I’ll insert a Line Chart into the report for which I’ll go to the Report tools > Design tab > Insert group > Chart command and insert such a chart. 

As shown above, when you insert the Line Chart, automatically it takes two fields:

  • Remaining Cumulative Work
  • Remaining Cumulative Actual Work

Considering the filter, grouping and outline level:

  • Filtering is by Active Tasks
  • There is no grouping applied.
  • Outline level is at the Project Summary level.

Applying Filters and Grouping 

Next, I’ll change the view of the above chart and apply the in-built group: Sprint. With this the view will change as shown below. 


As shown in the above figure:

  • The chart area has been expanded. 
  • The grouping is now by Sprints. The outline level has changed to Level 1.
  • There are different lines for the fields of Remaining Cumulative Work and Remaining Cumulative Actual Work.
  • There are lines for “No Sprint”, “Sprint 1”, “Sprint 2”, and “Sprint 3”.

Customizing Multiple Sprint Burndowns

We have to customize this burndown chart showing multiple Sprints because there won’t be any data for “No Sprints” and “Sprint 3”. As I apply the filters and enter the timeline needed, we will have the following view. 


In the above view:

  • We have information for two Sprints: Sprint 1 and Sprint 2
  • The timeline has been edited to consider the time till the end of Sprint 2, which is Friday October 7th, 2022.

Next, I’ll add the data labels for the lines and with it, the following view will appear. 

Let’s interpret the above figure:

  • For Sprint the Remaining Cumulative Actual Work line is slightly orange
  • For Sprint 1, we have two lines, for which the Remaining Cumulative Actual Work line is visible. This is because the Remaining Cumulative Work line is just behind.
  • For Sprint 2, we are mid-Sprint. There are two lines for Sprint 2: The Remaining Cumulative Work is in blue color coding, whereas the Remaining Cumulative Actual Work is in green color coding. 

As you can effectively, we now have a single view of two Sprint Burndown Charts, i.e., the Burndown Charts for both Sprint 1 and Sprint 2.

Another View – Multiple Sprint Burndowns

There is another way you can also visualize the charts. For this purpose, I’ll change the Line Chart to a Stacked Line Chart. With this change, we will have the following representation.  

Now we can see 4 burndown lines for both Sprint 1 and Sprint 2 representing the Remaining Cumulative Work and Remaining Cumulative Actual Work. 

Conclusion

As noted in the beginning of this article, there are some scenarios where you might want to have a look at multiple Burndown Charts in a single view. 

There can be many reasons for it. For example, you want to know how the work had progressed in the previous Sprints and how it’s progressing in the Current Sprint. It’s also possible that some of your stakeholders may want to have such a visualization. 

I believe with this article you realize that such a chart is possible to be created, customized and presented.


References

[1] NEW Online Course: Mastering MS Project 2019 Agile (Scrum and Kanban), by Satya Narayan Dash 

[2] NEW Certification Course: Certified Hybrid-Agile Master with MS Project, by Satya Narayan Dash


Saturday, August 06, 2022

Sprint Burndown and Burnup Charts with MS Project Agile


In this article, we will learn how to build Burndown and Burnup charts using MS Project Agile. Burndown and burnup charts are two frequently and widely used charts in projects using Agile frameworks - particularly the Scrum framework. These can be generated at the Iteration (Sprint) level or Release level. You can even decide your own custom level to generate and analyze such charts.

The content of this article is directly from two new Agile courses. For in-depth understanding of MS Project Agile and certification on Hybrid-Agile, you can use these courses:

These charts are important because, in Agile approaches, emphasis is on getting the work done and having working increments in every iteration or a timebox as much as possible. For a flow-based Agile, too, the focus is on delivery (on-demand), though iterations usually don’t exist in such approaches. As I’ve explained in a previous article, flow-based Agile can benefit from cadences.

Now, let's start with a real-world project scenario. 

Scrum Project Scenario *** UPDATED ***

Our current project is building a stock trading system using the Scrum framework. We have multiple Sprints planned, but detailed planning is only currently available for the first Sprint, i.e., Sprint 1. This is depicted in the below figure. 


As shown, the first Sprint has:

  • Three feature items to be delivered within the timebox – Login to the online trading system, Create a new user, and Edit an existing user.
  • Each feature has been broken down into individual tasks with durations and resources applied.
  • All Scrum events, such as Sprint Planning, Daily Scrum, Sprint Review, and Sprint Retrospective are available in this Sprint 1’s backlog.
  • All the work items for Sprint Backlog have been associated with the Sprint 1, which is our current Sprint.
  • The Sprint 1 starts on Monday, September 12, 2022, and completes on Friday, September 23, 2022. This can be seen with the newly added columns of Sprint Start and Finish in the Gantt chart view.

For information on how to prepare a complete Sprint Backlog, you can refer to this in-depth article.

Set the Status Date *** NEW ***

The burndown and burnup charts are fundamentally progress related reports. Therefore, to have progress reported, we have to set the status date, which can be done by going to the Project tab > Status group > Status Date: command. 


As shown, we have set the status date to be Monday, September 19, 2022, which is one week after the Sprint Start date.

We need to have certain tracking done on the status date, as well. Without it, a proper Burndown or Burnup chart is not possible! As tracking occurred for the current Sprint, we have the following information with respect to the progress. The tracking will happen with respect to the status date.

In the below figure, I’ve applied my custom grouping of Sprints followed with Task Summary Names. I’ve also added the % Complete field into the Current Sprint Sheet view. I hope this will help you to more easily understand the progress of the current Sprint. 

As of the status date (Monday, September 19th), we have the following progress:

  • Feature item, “Login to the online trading system,” is 100% complete.
  • Feature item, “Create new user,” is 55% complete, whereas feature, “Edit an existing user,” is yet to have begun.
  • The Sprint 1 Planning event has been completed, and a number of Daily Scrums are also completed.
  • The cumulative percent complete for Sprint 1 is 57%, and cumulative work is 312 hours.
  • The % of completion of the work items are taken from the settings in the Board view. The corresponding board columns’ states are reflected in the Board Status column of this sheet view.

Remember, when you track the work items, you do that in the Current Sprint Board view. This is applicable for either stand-alone Agile or Hybrid-Agile environments. The corresponding Current Sprint Board view for this project will be as shown below. 


It’s time to proceed to the Burndown Chart creation.

Building a Sprint Burndown Chart

A Burndown chart shows the remaining cumulative work. You start with total cumulative work and track daily how much work you have completed or burned as compared with the status date. Hence, the name, Burndown, because you are burning down work.

A Burndown chart shows the progress of the team within the iteration. Simply put, it is a visible chart that shows the remaining cumulative work for an iteration or Sprint, if you are using the Scrum framework. You can learn more on various Burndown Charts in this article

Now, we are going build upon this report. To create the first-cut of the Sprint Burndown Chart, I’ll go to Report tools > Design > Insert > Chart command, and use the simple Line Chart. 

In this Line Chart, ensure two fields available, which are crucial for the Burndown Chart:

  • Remaining Cumulative Work: It informs the total remaining cumulative work of the Current Sprint. This is represented by the line having blue color coding.
  • Remaining Cumulative Actual Work: It informs the total remaining cumulative actual work of the Current Sprint. This is represented by the line having an orange color coding.

These fields can be selected in the Field List command pane, which is highlighted in the above figure. If this command pane is not available, enable it by going to Chart Tools > Design tab > Show/Hide group, and choosing the Chart Data command.

Apply the Filter and Group *** UPDATED ***

As we are in the Current Sprint (Sprint 1), you should also ensure that the necessary group and filter are applied:

  • The built-in group applied is Sprint group, which groups among the Sprint. Say you have three Sprints, hence in total you have three groups, with two lines for each group.
  • The built-in filter applied is Current Sprint filter, which considers only the Current Sprint work items. This is because, in a project, one can have a number of Sprints, which in turn can be associated with multiple releases.
  • Applying the filter ensures that only the Current Sprint’s work items are shown.

The applied group and filter are highlighted in the above figure. Also ensure that the level is proper. In our case, we are at level-1.

Customizing a Sprint Burndown Chart

Next, we are going to customize the report to make it readable, presentable, and understandable. As a first step, I’ll enlarge the Chart Area and add labels for both the Remaining Cumulative Work and Remaining Cumulative Actual Work lines. To do this, simply select the corresponding line, right-click, and use the Add Data Labels command.

This will add the data labels to the lines, which will be in hours because units for the Remaining Cumulative Work and Remaining Cumulative Actual Work are in hours.

After you add the Data Labels, your chart will show as the below figure. You’ll want to format the Data Labels next. To do so, select any one of the Data Labels (which will select all of them). Then, right-click and select the Format Data Labels command, as shown below. 

Next, in the pop-up Format Data Labels command pane, ensure the correct label positions by going to Label Options > Label Positions. The positions will be as follows:

  • Below the line for Remaining Cumulative Work.
  • Above the line for Remaining Cumulative Actual Work. 


In addition, I’ve done a bit more formatting with color coding:

  • For the Remaining Cumulative Work, the labels have light blue color coding.
  • For the Remaining Cumulative Work, the data labels have light orange color coding.

This can be done in the above Format Data Labels command pane, by going to Label Options > Fill > Solid Fill and choosing appropriate color coding. This step ensures populated values are not only properly visible, but also clearly associated.

Finally, our Burndown Chart for the Current Sprint, will show as below. 

In the final cut of the Sprint Burndown Chart, I’ve also renamed the report, “Current Sprint Burndown Chart.”

In this chart:

  • The work is progressively getting burned down over the duration of the Sprint.
  • The planned/ideal burndown is depicted via the Remaining Cumulative Work line, whereas the actual burndown is depicted via the Remaining Actual Work line.
  • After the status date, there has been no tracking. Hence, the Remaining Cumulative Actual Work line is parallel to the time axis.
  • However, the Remaining Cumulative Work line continues to slide further and finally meets the time axis on the final day of the Sprint.

Building a Sprint Burnup Chart *** UPDATED ***

Unlike a Burndown chart, a Burnup chart shows work complete or total cumulative work complete as of the status date. You may also want to show the scope creep – scope that is changed, but not committed. You can learn more on Iteration Burnup Charts in this article.

To create a Burnup Chart from scratch, again we have to go to the Report tab > View Reports group > New Report command and choose Blank report. The subsequent steps will be similar as for the Burndown chart, except for two key changes:

  • Instead of Remaining Cumulative Work, you’ll want to have Cumulative Work, i.e., the amount of work planned to be completed as of the status date.
  • Instead of Remaining Cumulative Work, you’ll want Cumulative Actual Work, i.e., the amount of actual work completed as of the status date.

These fields can be selected from the “Field List” command pane as shown below: 


While customizing the Current Sprint Burnup Chart, one needs to follow the exact steps that we followed for the Current Sprint Burndown Chart. The final Sprint Burnup Chart is shown: 

As you can see, the report is based on the status date. In this Line Chart, we have two crucial fields:

  • Cumulative Work informs the total remaining cumulative work of the Current Sprint. This is represented by the line having blue color coding.
  • Cumulative Actual Work informs the total remaining cumulative actual work of the Current Sprint. This is represented by the line having an orange color coding.

Just below the lines, I’ve also added the Data Table for the chart. In some cases, this gives clarity with respect to work hours on every day of the Current Sprint. As you can see, after the status date, there is no update to the cumulative actual work. 

Demonstration and Analysis

To provide more clarity on these charts, I’ve prepared a demonstration on what we have learned so far. It’s explained in the following video [duration: 9m: 14s]. The content is taken from my new course, Mastering MS Project 2019 Agile. For the best experience, you may want to go full-screen in HD mode and plug-in your earphones.


Conclusion

Burndown and Burnup charts are widely used by Lean-Agile teams to visualize work remaining and work completed, respectively. The MS Project tool with its Agile features has a number of additional functionalities available to work such charts:

  • The reports can be exported to PDF files, which is quite useful if stakeholders don’t have MS Project installed.
  • One can have Burndown/Burnup charts not only for work, but also for tasks, cost, among others.
  • With the Sprint Task Burndown Chart, you can see the remaining tasks over time for the Current Sprint. You can also create the Task Burndown Chart for the entire project.
  • Create a Custom Burndown Chart with custom date ranges, which helps to identify the tasks or work completed within the desired date range.
  • For a Hybrid-Agile project, you can create the Burndown or Burnup charts for the Agile and predictive parts, separately. You can also have a combined view of the Burndown/Burnup chart for the entire Hybrid project.

I hope this article gave you a detailed understanding of working with the Sprint Burndown Charts using MS Project Agile features.

The last couple of years have been quite difficult with a lot of suffering for many around the world due to the Covid19 pandemic. I wish all my readers, around the world, a very happy 2022. May it bring happiness and joy to all of our lives.

--

This article was first published by MPUG.com on 27th December, 2021. This is a refined and updated version.

References

[1] NEW Online Course: Mastering MS Project 2019 Agile (Scrum and Kanban), by Satya Narayan Dash

[2] Online Course: PMI-ACP Live Lessons, Guaranteed Pass, by Satya Narayan Dash

[3] e-Book: I Want To Be A PMI-ACP, Second Edition, by Satya Narayan Dash

[4] NEW Certification Course: Certified Hybrid-Agile Master with MS Project, by Satya Narayan Dash