Thursday, October 06, 2022

Understanding Planned and Actual Percent Complete with MS Project


While interacting with MS Project users across a couple of industry verticals recently, I encountered a question from a senior mechanical engineering lead regarding Planned and Actual Percent Complete fields. The lead was managing a bridge construction project in the Middle East.

The client’s requirement was to show both Actual Percent Complete and Planned Percent Complete in the MS Project Plan. The (Actual) % Complete should have been visible in the tabular view of the Gantt Chart and in the generated histogram reports for L2 or L3 tasks of the work breakdown structure, but MS Project doesn’t have a Planned % Complete field. This had to be created.

Another problem the engineering lead faced was getting negative values while having the planning percent complete with the created custom fields formula for the milestones. Obviously, this stemmed from the way the formulas were put in!

Inspired by his project, I decided to write this article on the topic of Planned and Actual Percent Complete data within MS Project. We will explore the concept of Planned Percent Complete and how to track it using the custom fields available in MS Project. I will also show the scenario by insertion of the milestone/task and recalculation. In the end, I’ll be creating a histogram report which compares the Planned and Actual Percent Complete.

Fundamentals–Baseline and Status Date

As a management professional, you need to understand that comparison always happens against the latest baseline after one sets the status date. Many miss this aspect. The whole idea of having a baseline is to have a comparison and measure progress.

To explain how to spot this comparison, I’ve created the below video [Duration: 3m:44s]. For the best experience, you may want to go full-screen in HD mode and plug-in your earphones. 


With these fundamentals in mind, let’s proceed to checking a few functions and fields in MS Project.

Functions and Fields

MS Project becomes a very powerful tool when you use its custom fields, functions, and build your own formulas. Rarely a software project management tool comes with such a large number of in-built fields and functions. For the purpose of this article, we are going to use the Date() function.

ProjDateDiff

As per MS Project software API documentation, this function returns the duration between two dates in minutes. Hence, when we wish to calculate in days, we have to divide by 480, because a day will have 480 minutes.

Syntax:

ProjDateDiff( date1, date2, calendar )

In this function:

  • date1 (required field): The date used as the beginning of the duration.
  • date2 (required field): The date used as the end of the duration.
  • calendar (optional): The calendar to use when calculating the duration.

DateDiff

Another widely used Date() function is the DateDiff() function,  which, as per MS Project software API documentation, also returns a time interval between two dates in a long format.

Syntax:
DateDiff( interval, date1, date2[, firstdayofweek[, firstweekofyear]] )

In this function:

  • interval and dates (required fields): The interval time between date1 and date2.
  • firstdayofweek and firstweekofyear (optional fields): The first one is a constraint constant that specifies the first day of the week, whereas the second one is a constraint constant that specifies the first week of the year.

For the sake of example, I’m going to use the ProjDateDiff() function. Nevertheless, you can use the DateDiff() function, as well.

Fields Used

Of the available built-in fields in MS Project, we are going to use:

  • Baseline Start: Gives the baseline start date of the task.
  • Baseline Duration: Gives the baseline duration of the task.
  • Status Date: Gives the status date of the project.

The Project Plan

As you can see, we have the below project with its phases, work packages, and milestones. 

Note:

  • There are two phases, Phase 1 and Phase 2.
  • Each phase has four work packages and ends with a milestone.

I am going to show you how to put in formulas to calculate the Planned % Complete for all the tasks in MS Project.

Steps Involved

To build and calculate the formulas, I’ll follow five steps.

Step – 1: Set the Baseline

As I’ve said before, without setting the baseline, we can’t do the calculation. To the set the baseline, go to the Project tab > Schedule group > Set Baseline. Then, execute the “Set Baseline…” command, as shown below. 

Step – 2: Set the Status Date

Next, we are going to set the status date, for which you have to go to the Project tab > Status group, and use the “Status Date:” command. 
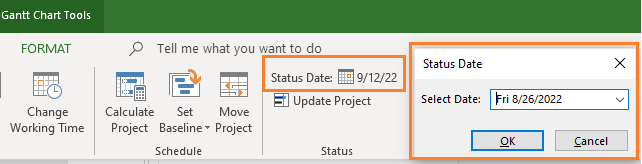
Note that as one works with the project and its progress, the status date can be updated accordingly.

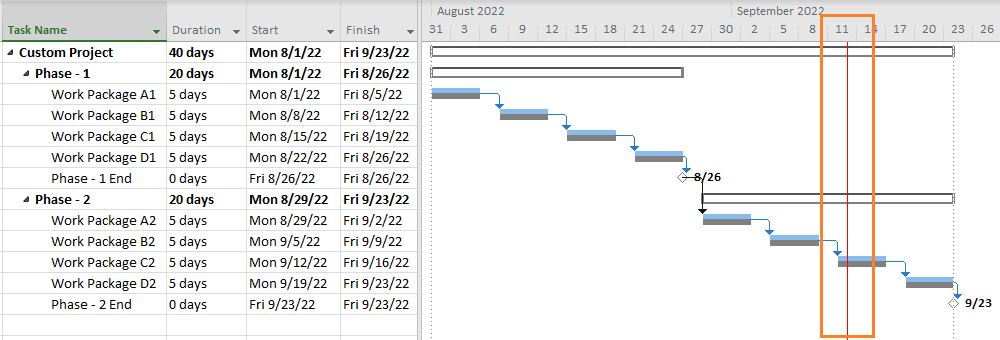
You may want to see the status date in the Gantt chart view, which can be done by going to the Format tab > Format group > Gridlines, and executing the “Gridlines…” command. 

For the sake of this example, I’ve set the status to show with a normal line and red color coding. The status date will be visible now in the Gantt Chart View along with the baseline. This is shown below.
          

Step – 3: Create the Needed Custom Fields

For the purpose of our calculation, we are going to have three number custom fields and one text custom field:

  • Number1: This will hold the difference between the status date and baseline start.
  • Number2: This will hold the baseline duration of the task concerned.
  • Number3: This will hold the formula comparing the position of the status date with respect to the baseline values.
  • Text1: This will convert the “Number3” into percentage representation.

To use these custom fields, go to the Format tab > Columns group, and execute the “Custom Fields” command.

As highlighted above, we will be using three number custom fields (and a text custom field). Ensure that the formula is applied and the calculation for task and group summary rows use the formula embedded into the appropriate custom field.

Step – 4: Determine Planned % Complete

For each of the three number fields, we will be using these formulas.

Number1: ProjDateDiff([Baseline Start],[Status Date])/480

The Number1 field will hold the value of difference between Baseline Start and Status Date. If the Status Date is ahead of the Baseline Start, then it will be positive, whereas if behind the Baseline Start, it will be negative.

Number2: [Baseline Duration]/480

This will hold the Baseline Duration of the task.

Number3:

IIf([Number1]<=0,0,

IIf([Number1]>=[Number2],100,

IIf(([Number1]<[Number2]) AND ([Number2]>0),

[Number1]/[Number2]*100,0)))

This custom field holds the main algorithm and uses the IIf() function of MS Project. The algorithm is built on explanations given in the first video.

Step – 5: Format Planned % Complete

Finally, we will convert the Number3 custom field into a Text one. I’ve used the below formula for the Text1 custom field:

Text1: cStr([Number3] & “%”)

We need to concatenate the string value of Number 3 with “%.” The “Text1” custom field also has to be renamed as “Planned % Complete”.

After you have populated the custom fields with the above formulas, you’ll see the below. 

Let’s interpret the above figure:

  • The status date is set as Sept 12, 2022.
  • For Phase – 1:
    • All tasks (work packages) are planned to be completed by the status date. Hence, these are shown to be 100% complete.
    • The cumulative planned % complete for Phase – 1 is at 100%.
  • For Phase – 2:
    • “Work Package A2” and “Work Package B2” are planned to be completed fully. Hence, these are shown as 100%.
    • The status date is 1 day into “Work Package C3,” because it starts on Monday, Sept 12, 2022. Hence, the planned % complete for this task will be 1/5 = 0.2 or 20%.
    • The cumulative planned % complete for Phase – 2 is at 55%.
  • The cumulative planned % complete for the entire project is 77.5%.

Planned Vs. Actual Percent Complete

Now that we’ve walked through how to calculate and use the Planned % Complete, let’s look at it alongside the Actual % Complete column. As noted earlier, “% Complete” in MS Project informs on the actual percentage completed for a task. To show both, I’ve added one more column into the tabular side of the Gantt Chart, as depicted below: 

I’ve renamed the title field for “% Complete” by going to the Format tab > Columns group > Custom Settings, and executing the “Field Settings” command. 

As we track the project’s progress, both planned and actual percent complete fields will populate, respectively, as shown. 

Let’s interpret the above figure:

  • The status date is again on Sept 12, 2022, when we started tracking.
  • For Phase – 1:
    • As on the status date, Work Package A1 and B1, as well the Milestone “Phase -1 End,” are actually complete, and, hence, are all showing to be at 100% completion.
    • Work Package C1 started on time, but took 2 more days to complete.
    • Work Package D1 has seen 2-days’ worth of work, but has 4-days remaining. While the actual % complete is 2/6 or 33%, the planned percent complete is 100%, as we have seen earlier.
    • The cumulative actual % complete for Phase – 1 is 83%.
  • For Phase – 2:
    • Work Packages A2 and B2 are at 75% and 50% actually completed. Compared to the status date, the planned percent complete is 100%.
    • Work Package C2 has seen 1-day’s work and still has 6-days of work remaining. Hence, the actual % complete is 1/7 or 14%, whereas the planned % complete is 20%, as we have seen earlier.
    • The cumulative actual % complete for Phase – 2 is at 33%.
  • The cumulative actual % complete for the entire project is at 58%. On the other hand, as seen earlier, the cumulative planned % complete is 77.5%.

More on Planned % Complete

There are certain scenarios where ‘#ERROR’ notifications are shown in the MS Project software. These confound many MS Project practitioners, and I felt that exploring a few such scenarios would be best done in the below video [Duration: 6m:07s], which I’ve created for this article. The scenarios explored are: No Status Date, No Baseline, Addition of New Tasks and Re-baseline.  


Creating Histogram – Planned Vs. Actual % Complete

So, what do we do with the data? MS Project comes with a large set of built-in reports, as well as allows you to create your own customized reports. Let’s create a histogram to show the Planned vs. Actual % Complete data to a customer or stakeholder.

Create a custom Histogram Report by going to the Report tab > New Report > Chart, as shown below. 
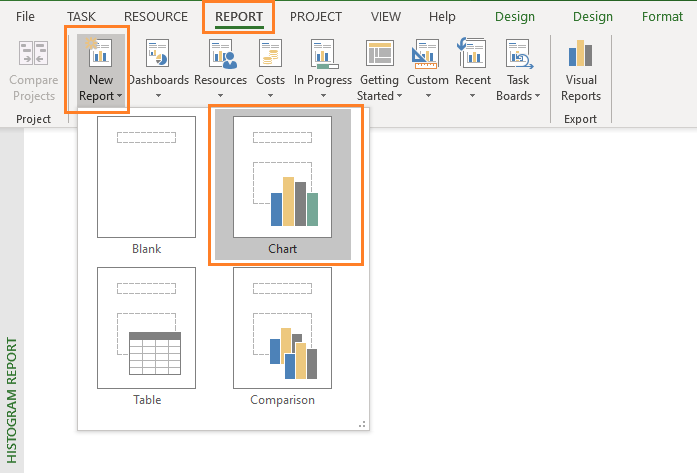

Select the custom field related to Planned % Complete and the already available field of (Actual) % Complete in the “Field List.” The histogram report will show both these fields in its report. 

With a little bit of further customization, labelling, axis value population, and formatting, the histogram report will come out as shown below. 


--

This article was first published by MPUG.com on 10th August, 2021. 


References:

[1] Online Course: MS Project Live Lessons, by Satya Narayan Dash.

[2] Documentation: Project Functions for Custom Fields in MS Project, by Microsoft Corporation.


Sunday, September 25, 2022

A Masterclass in Leadership: Understanding Leadership Growth Levels and Its Application


Recently, I wrote an article on leadership and what leaders do. It informs on the following:

  • Who is a Leader?
  • Leadership Vs. Management
  • Authority Vs. Leadership
  • Leadership Growth Levels
  • Leadership Styles
  • Exercises (video)

You can read the complete article here:

Leadership, Leadership Growth Levels and Leadership Styles for Project Managers

I strongly suggest that you read the above article before proceeding with this specific one on Leadership Growth Levels and its application. In the above linked article, the leadership growth level has been depicted with the following figure.  


I also noted:

“The lower levels of leadership are Positional (Level-1/L1) and Relational (L2). At L3, Inspiration, you have started to truly move up. When you deliver results (L4), you are established as a leader. The higher levels of leadership are Mission (Purpose), and Passion. The highest level is Culmination (L7), which very few reach.”

With this foundation, let’s understand the Leadership Growth Levels in more detail. Towards the end of this article, you will learn how the levels are applied.

Level–1 (L1): Position

We all begin somewhere in a team or organization. Only exception is your family, where the team has been built over years, early in your life.  

You start at a positional level (L1), because of your designation, title, hierarchy or position. For example, when you are hired as a manager, you are actually at L1. You have been hired because of potential or past performance. This is the foundation on which you have to build further.

Level–2 (L2): Relation

It is the next level up when compared to the positional level. You have moved up because you are building relationships with your team members, colleagues within the organization or across organizations. Even within a family, your position as an eldest sister (say likely to be respected) or youngest brother (say likely to be adored) won’t be stable if you don’t work on your relations continuously.  

An old-age saying in leadership goes as follows:

People follow leaders whom they trust. 

Trust is the foundation of leadership. How do you develop trust? It starts first by building relations and gets concretized with your character as you move up.  

At this level, you have taken your first and real step towards leadership. At this level, you are not living off your position, title or designation, but relying on influence built through relations to lead. 

Level–3 (L3): Inspiration

In my classes and interactions, I find managers without energy, desire or passion to excel. Some of them have no motivation at all. They are tired by their daily grind of work, family issues or other challenges. Work has no genuine meaning except to earn a salary and pay the bills.

Why does this happen? 

A lack of inspiration. This is where leadership comes in. Because inspiration is really hard. 

When you see zombie-like employees, workers or people lacking any enthusiasm or motivation, it’s first and foremost a leadership failure. To inspire others, the first person who must be inspired is you. 

Level–4 (L4): Fructification

In certain leadership literature, this may be called “production” or “reproduction”. I’ve thought hard about the usage of such words. I believe such words have an emotion-less, non-human and a machine-like connotation. 

People are not machines for production. They all have wants, hopes, desires and aspirations. Hence, fructification is more appropriate. It also signifies one more aspect – the pain of building something and pleasure of seeing your effort blooming like a flower or fructifying on a tree that you have planted. 

With fructification, your work is finally producing results. Results speak the loudest, above anything else. 

Some think that fructification means a one-time effort: you have got the fruit, used it and it’s over. Wrong! Imagine a mango or orange grove or a tea garden. Do you have just one fruit, one tree, or many?

You get many fruits when you plant many trees. The trees that you are planting are the leaders of the future and they will bear more fruits.

Level–5 (L5): Mission

As noted earlier, this is a higher level of leadership. At this level, you are driven by a purpose. You are no longer satisfied with the results being delivered, but want to move with purpose. 

Purpose is the why aspect of leadership. It articulates your reason for existence as a leader and tells you where to go. In fact, purpose gives meaning to an organization's (and leader’s) existence. 

Mission is accompanied with the values. Along with vision, mission tells exactly where you are going, and the values describe the behaviors needed that will get you there. Vision created at the level of Passion (L6) meets your Mission at L5. 

Level–6 (L6): Passion

This is another higher level of leadership and as the first figure depicts, it’s above the level of purpose. Why?

Because at this level, you are deeply driven by your principles, values and beliefs. In fact, you have full conviction of their worth, worthiness and impact on your team or organization. Passion is the fuel that propels your journey.

A key aspect at this level is the creation of vision. Vision is the future state of an organization or product/service being offered. Vision provides long term direction. As you have consistently delivered at L4 and moving with a purpose at L5, the vision becomes clearer for you and hence, vision is embryonated here. 

Many think a vision is like a light-bulb suddenly going in the leader’s head and then the leader immediately starts working on it. While rarely and occasionally it might be true, in fact, many times a vision emerges. 

Level–7 (L7): Culmination

As noted in the beginning of this article, this is the highest level of leadership, which very few reach. At this stage, you have become a force of nature. People in the organization or community are drawn to the leader because the leadership is entirely principle driven, the leader himself or herself radiates values and lives by it. The leader rose to this level because the leader has consistently performed at L6, L5 and L4 for decades. Hence, it usually does not happen early or even at mid-level, but towards the later phases of life and career.

Such leaders not only transform organizations, but also create exceptional leaders within the organization or community for generations to come. That’s why with a L7 leader in an organization or community, the organization stays relevant and powerful for a very long time, sometimes more than a century. In some cases, such a leader’s philosophy and teachings resonate for millennia. 

Application of Leadership with Leadership Growth Levels

Now that we have learned the leadership growth levels, next obvious question is:

How leadership is applied considering the levels?

When you apply leadership, it’s in reverse. It’s paradoxical, but true and real. Effectively if you look at the application of true leadership, our first figure gets inverted, which is shown below.

The above figure illustrates the following:

  • Your passion creates a vision. 
  • Vision enables your purpose or mission.
  • With vision and mission, you are producing results, i.e., fructification.
  • Consistent fructification inspires people. 
  • Inspiration builds more relations and draws more people into your orbit. 
  • Finally, decisions are taken who are the potential leaders who can hold new positions.

So, while you are growing as a leader from position to relation to passion, when you are a true leader, you have the vision implemented in a reverse way. Though it may not be easy to absorb in you first reading, if you go through a few times, you will understand how and why it works that way. 


References:
[1] NEW Course: A Masterclass in Leadership, by Satya Narayan Dash
, CIPSA, CHAMP

[2] Article: Leadership, Leadership Levels, and Leadership Styles for Project Managers, published by Microsoft Project User Group (MPUG)


Wednesday, September 14, 2022

Building and Analyzing Kanban Cumulative Flow Diagrams with MS Project Agile


Like Sprint or Release Burndown charts in Scrum, cumulative flow diagrams (CFDs) are frequently used in projects using a Kanban framework. This is because one of the fundamental aspects of Kanban is this: Manage the flow. With a cumulative flow diagram, we can manage the flow of work.

Imagine an Agile development team is delivering a number of features on-demand. The team is following a Kanban mode with Testing being a workflow state. If the team has many features developed, but is waiting to test, then the development band/state in the Kanban board will be narrow, and the testing band will be wide. A cumulative flow diagram assists.

The content of this article has been taken from these new courses:


The Cumulative Flow Diagram Basics *** UPDATED ***

A Kanban cumulative flow diagram shows work in progress in the Kanban board. As the name indicates, it is a flow diagram and is cumulatively represented. It gives insight into how many items are completed, how many items are remaining, and where the bottlenecks are in the process flow.

In the CFD below, I’ve taken the cumulative diagram for the number of issues coming to the development team on a weekly basis. There are three workflow states: “TODO,” “DOING,” and “DONE.”

Let’s interpret the diagram. Obviously the TODO items are getting added up at a faster rate, whereas the DOING and DONE are not able to catch up. TODO items in the graph are getting widening, and just below that, the DOING flow state is shown as narrower. This means that the bottleneck is in the DOING flow state. Also, the team is not able to move the DONE items well, either. From a technical standpoint, it may suggest that the items taken on may need to be broken up, or it may be possible that the team is unable to deliver on the issues taken up. 

To understand more on how a CFD can help in finding the bottlenecks, you can refer the below video [duration: 03m:39s]. It's taken from ACP Live Lessons, Guaranteed Pass course. For the best experience, you may want to go full-screen in HD mode and plug-in your earphones.


With these basics, let's check our project scenario. 

Our Project Scenario
Our project is that of house renovation work, which is being done within the Kanban framework. There are a number of work items to be completed in the backlog, some in progress, and some done, as shown below in the Gantt Chart view.


We have planned for the capacity available for the team; however, some of the items are not planned at all.  This can also be seen in the Task Board view (or the Backlog Board) view by going to View tab > Task Views > Task Board > Task Board command.
 
As shown in the above figure:

  • A couple of work items are in “Done” and “In Progress” states
  • One work item is in “Next up” state. 
  • A number of items are in the Kanban Backlog state.

The project’s Status Date has been set for Monday, September 19, 2022, which is one week ahead of the Project’s start date. For this scenario, we are going to build our cumulative flow diagram from scratch.

Building a Cumulative Flow Diagram
To create a CFD, first we have to go to the Report tab > View Reports group > New Report command and choose Blank report. The dialog box opens, and the report named, Kanban Cumulative Task Flow Report, as shown below. 


Kanban Cumulative Task Flow Report
To create the first-cut of the CFD, we go to Report tools > Insert > Chart command and insert an Area chart.
 

As you insert the chart, you will have your first view of a cumulative flow diagram with two fields:

  • Remaining Actual Tasks shows actual tasks remaining over the timeline of the project and is highlighted with a blue color. 
  • Remaining Tasks shows tasks remaining over the timeline of the project and is highlighted in an orange color.

This is depicted below with the number of tasks in the Y-axis and the timeline by date in the X-axis. 


Next, we are going to customize this chart to provide more clarity and understanding.

Customizing a Cumulative Flow Diagram

To customize the chart, I’ll enlarge the chart area, add the data labels for both Remaining Actual Tasks and Remaining Task fields, and apply associated color coding to have more visibility. You can learn how to do such steps in this article on Sprint Burndown and Burnup Charts.

After you customize the chart, it’ll be as shown below. 


Note:
  • Data labels have been added for both Remaining Actual Tasks and Remaining Task fields.
  • Data labels have been formatted for both these fields, with light orange and light blue colors, respectively.
  • The Remaining Tasks start with a value of twelve and go down to zero when the project ends.
  • The Remaining Actual Tasks start with a value of twelve and go down to ten as on the Status Date, which we have set earlier.

Now, the main part is the analysis of this data according to the Status Date:

  • The Remaining Tasks are eight, whereas the Remaining Actual Tasks are ten.
  • It means we are not actually completing tasks as we have expected or planned.
  • We can see that we are somewhat behind our planned progress.

While this CFD shows the cumulative task flow report and informs on the progress of the tasks, it doesn’t inform on what is happening at the board level. In the earlier part of the article, I stated, that with CFD, we can find out where the bottleneck is in our workflow. We need to find out where the bottleneck is at the board level.

For that, we will use another cumulative flow diagram. There can be a number of variants, but we will focus on task workflow across the column states of the Kanban Board.

Cumulative Flow Diagram – Board Status
To change the above CFD into a chart with Board Status, we have to apply the built-in grouping available in MS Project: Board Status.

We can rename this report in the Organizer by going to Report tools > Design tab > Report group and using the Manage command, or we can create a new CFD report entirely. Let’s create a new report and following the previously mentioned steps. The new “Kanban Cumulative Flow – Board Status Report” is shown below:

 
To create this report, we had to apply the “Board Status” built-in group. This can be done by going to the Field List command pane (as you select the chart area) and changing the Group By setting to Board Status (under Tasks). It’s highlighted in the figure.
Next, I’ll customize this chart by adding, formatting, and adjusting the data labels, etc. See below.

Let’s interpret the above figure, as of the Status Date of September 19, 2022:

  • The work items in the “Done” board state (at the bottom of the chart) are progressing properly.
  • The work items in the “In Progress” board state (just above the “Done” state) are also on track.
  • The work items in the “Kanban Backlog” board state are not moving as expected.
    • For this board state, the Remaining Tasks are highlighted in light blue, and the Remaining Actual Tasks are highlighted in green.
    • As on the Status Date, the Remaining Tasks are seven, but the Remaining Actual Tasks are five in number.

Looking at the above CFD, one can say that movement of work items is not happening from the “Kanban Backlog” state to the “Next up” state. The “Next Up” board state is also having a narrower band. Hence, the bottleneck is there.

There can be many possible reasons for it. A few are listed below:

  • Perhaps the team is behind on analysis to be done before moving the tasks from the “Kanban Backlog” state to the “Next up” state.
  • Maybe the team has been occupied by some other work, hence the items from the “Kanban Backlog” state are not being moved out faster.
This has to be analyzed by the project manager (PM), the Kanban Flow Master, or whoever is in a similar role. Kanban explicitly doesn’t prescribe a particular role, but indicates respect the current roles, responsibilities, and titles.

Determining the ‘Work in Progress’
Another advantage of Kanban CFD is the ability to determine the work in progress (WIP) for the project. This is in-line with another fundamental aspect of Kanban: Limit the work progress.
Let’s do a little bit more customization for the above chart by keeping only the Remaining Actual Tasks in the view. I’ll also change the date range from project Start Date to Status Date below: 


As shown, we can now quickly determine the total number of work items in progress:
  • Done state = 0
  • In progress state = 2
  • Next up state = 1
  • Kanban Backlog state = 7
Hence, the following is true:

WIP = 0 + 2 + 1 + 7= 10

Kanban emphasizes limiting this work progress for the purpose of smoothing the process flow. The WIP limit is usually driven by the organization’s policy and can be adjusted for the project under consideration.

Demonstration and Analysis
To demonstrate the charts that we just created and analyzed, take a look at the below video [duration: 10m: 37s], which I’ve prepared in support of this article. The content of the video is from my course, Mastering MS Project 2019 Agile. 


Conclusion
As noted earlier, the main purpose of using a Kanban cumulative flow diagram is its assistance in managing the flow of work. Unlike Scrum, where you have Sprints, in Kanban, flow is emphasized. A CFD also helps in visualizing the workflow, understanding the work in progress, and identifying necessary process policies.
One can also use a cumulative flow diagram to analyze other Kanban metrics, such as:

  • Cycle time
  • Lead time
  • Response time
  • Little’s law, etc.

Remember to be judicious while using cumulative diagrams. For example, it does not inform how big or small the tasks are. Also, I’ve seen Kanban practitioners using the scale in X-axis on days when a high number of issues or work items are being worked upon. If you do that, you won’t get any value out of it. Another scenario is working with Hybrid-Agile projects. Some practitioners create CFDs for the entire project, which gives no value. You need to customize your CFDs only for the work items, which are pulled-based and just-in-time with an on-demand delivery pattern.

I hope that this article has given you have a fair understanding on how to work with cumulative flow diagrams within MS Project. Your comments are welcome below.

--

This article was first published by MPUG.com on 8th March, 2022. This is an updated version.


References
[1] NEW Online Course: Mastering MS Project 2019 Agile (Scrum and Kanban), by Satya Narayan Dash

[2] NEW Certification Course: Certified Hybrid-Agile Master with MS Project, by Satya Narayan Dash

[3] Online Course: PMI-ACP Live Lessons, Guaranteed Pass, by Satya Narayan Dash

[4] e-Book: I Want To Be A PMI-ACP, Second Edition, by Satya Narayan Dash